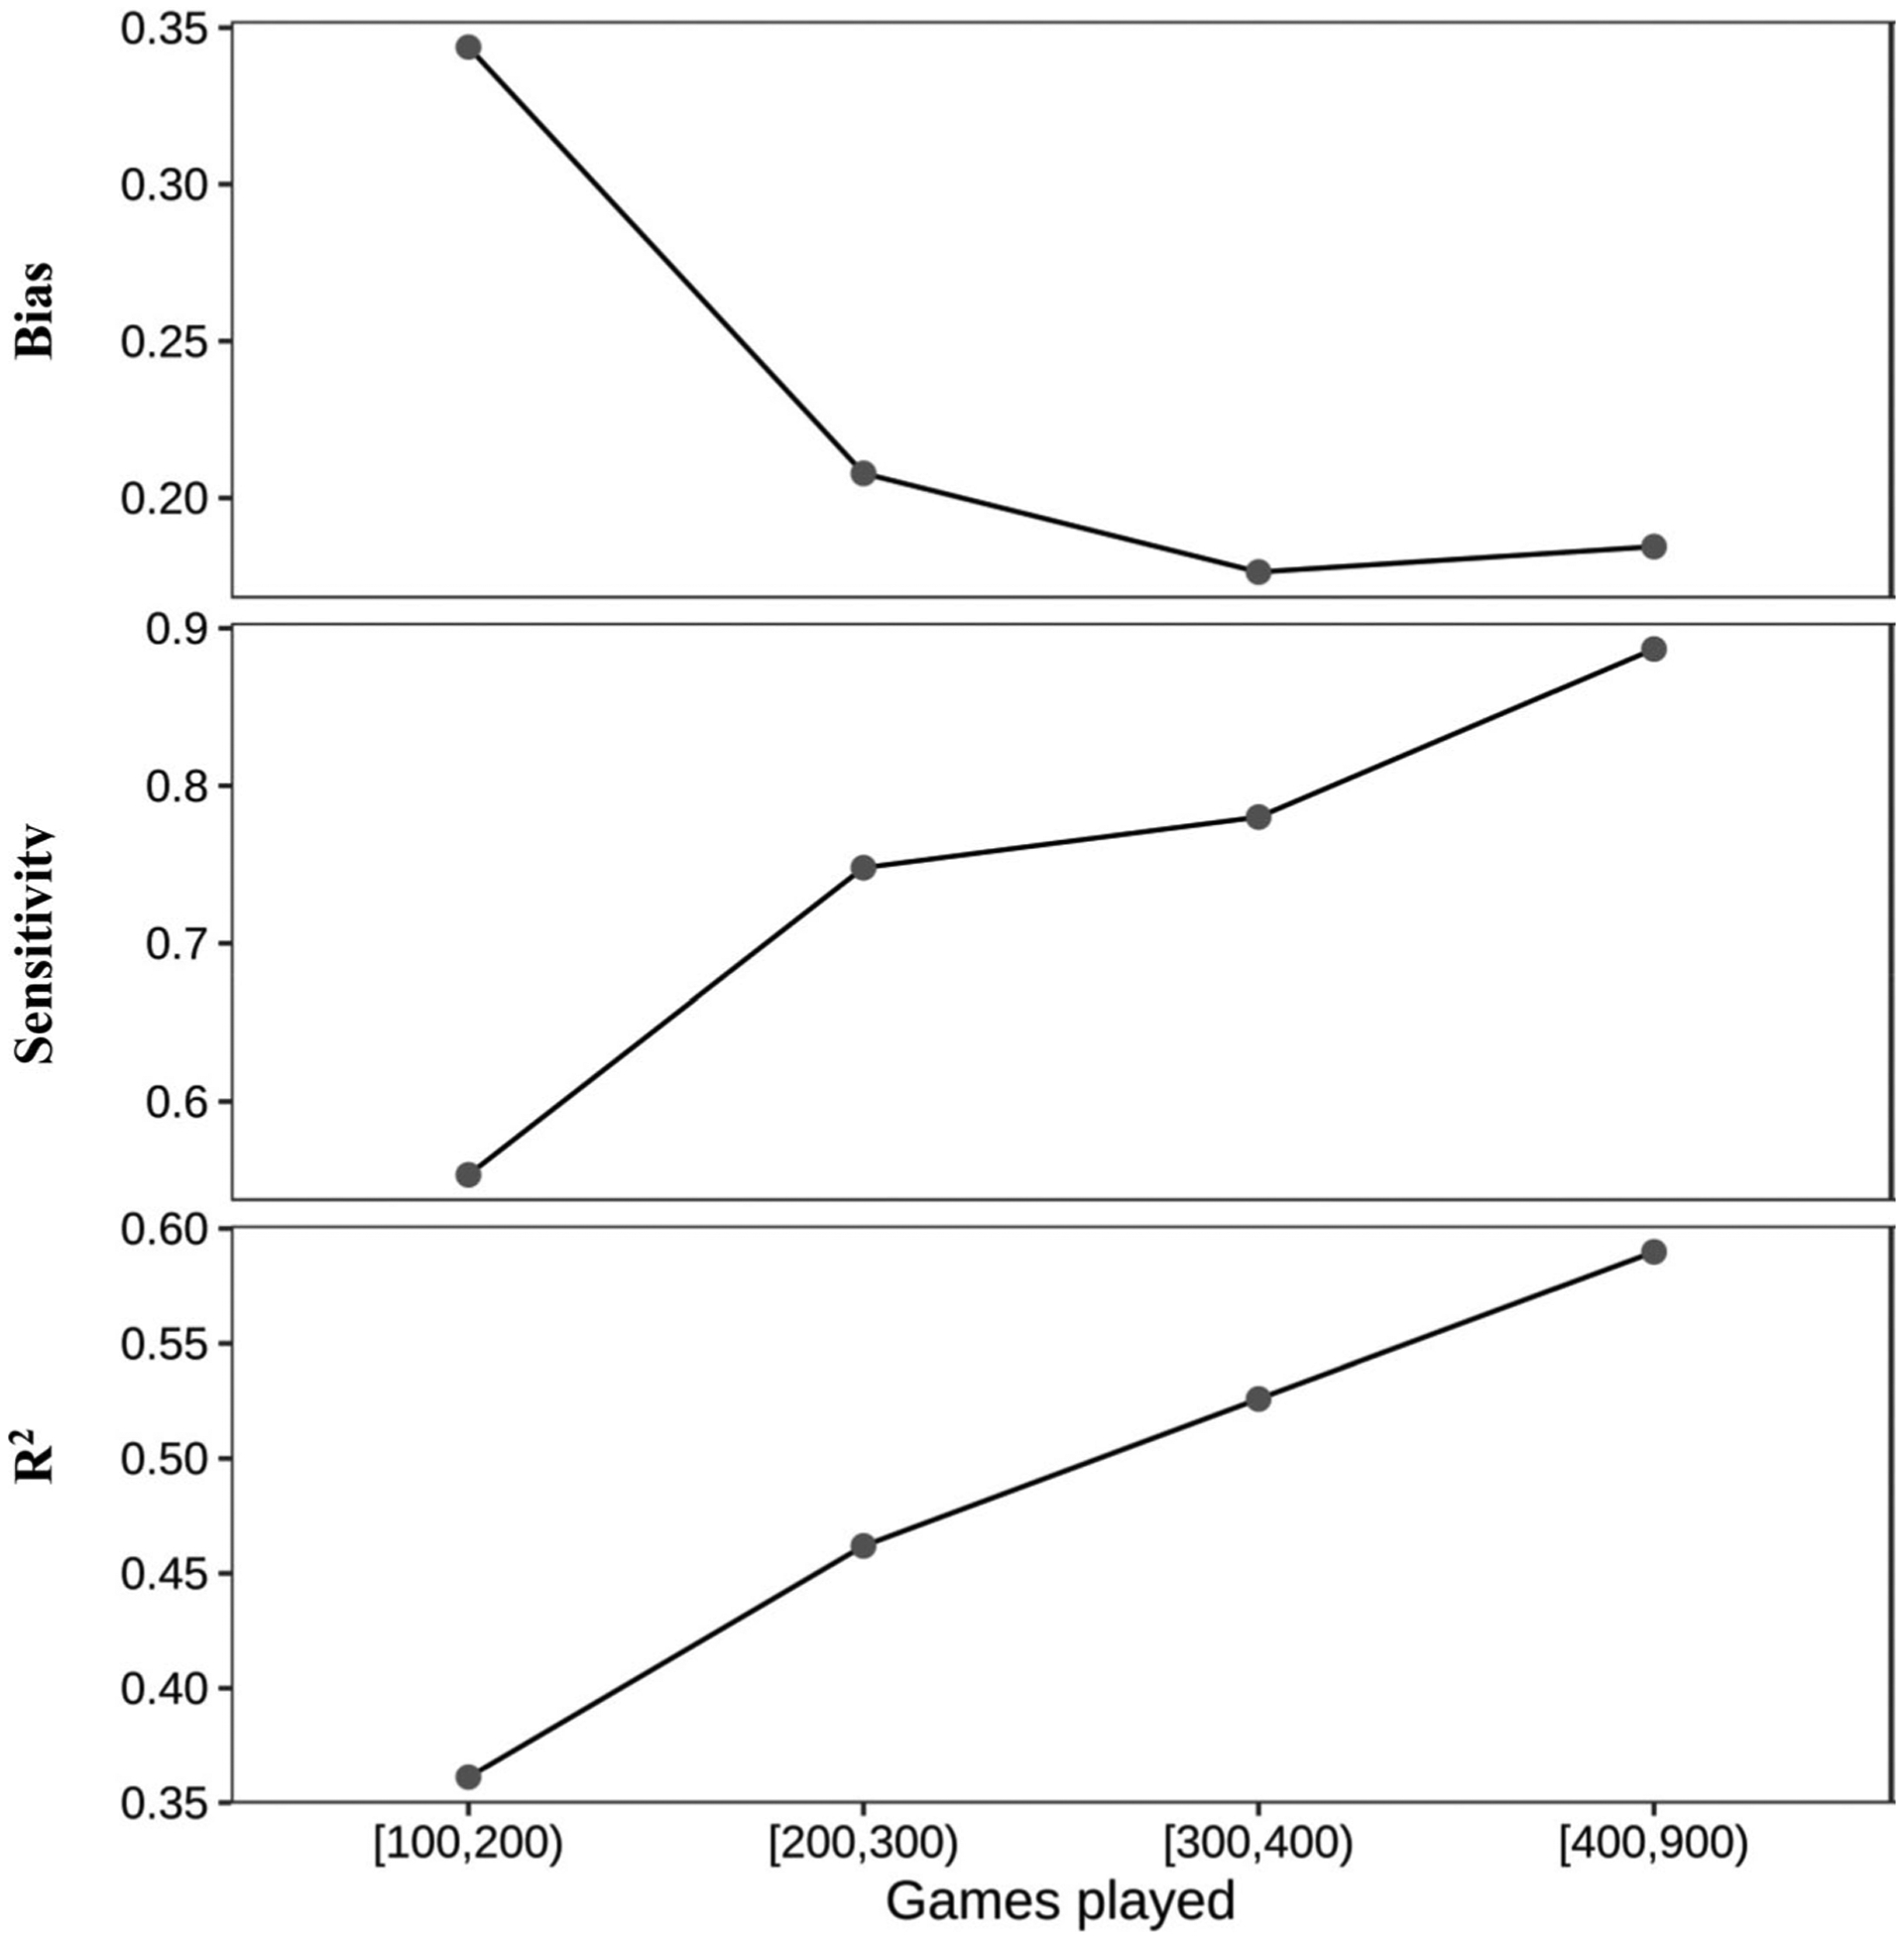
Figure 4.

Bias, sensitivity and proportion of variance explained (R2) by the line of best fit as a function of total games White has played. Note the change in vertical scale across panels. Game ranges are given in traditional mathematical notation, where a square bracket is inclusive, and a curved bracket is exclusive (e.g., “[100, 200)” indicates players with at least 100 games, but strictly less than 200). Note, as the number of games played increases, the number of players in that bracket decreases (i.e., n [100, 200) = 81, n [200, 300) = 41, n [300, 400) = 23, n [400, 900) = 24).
