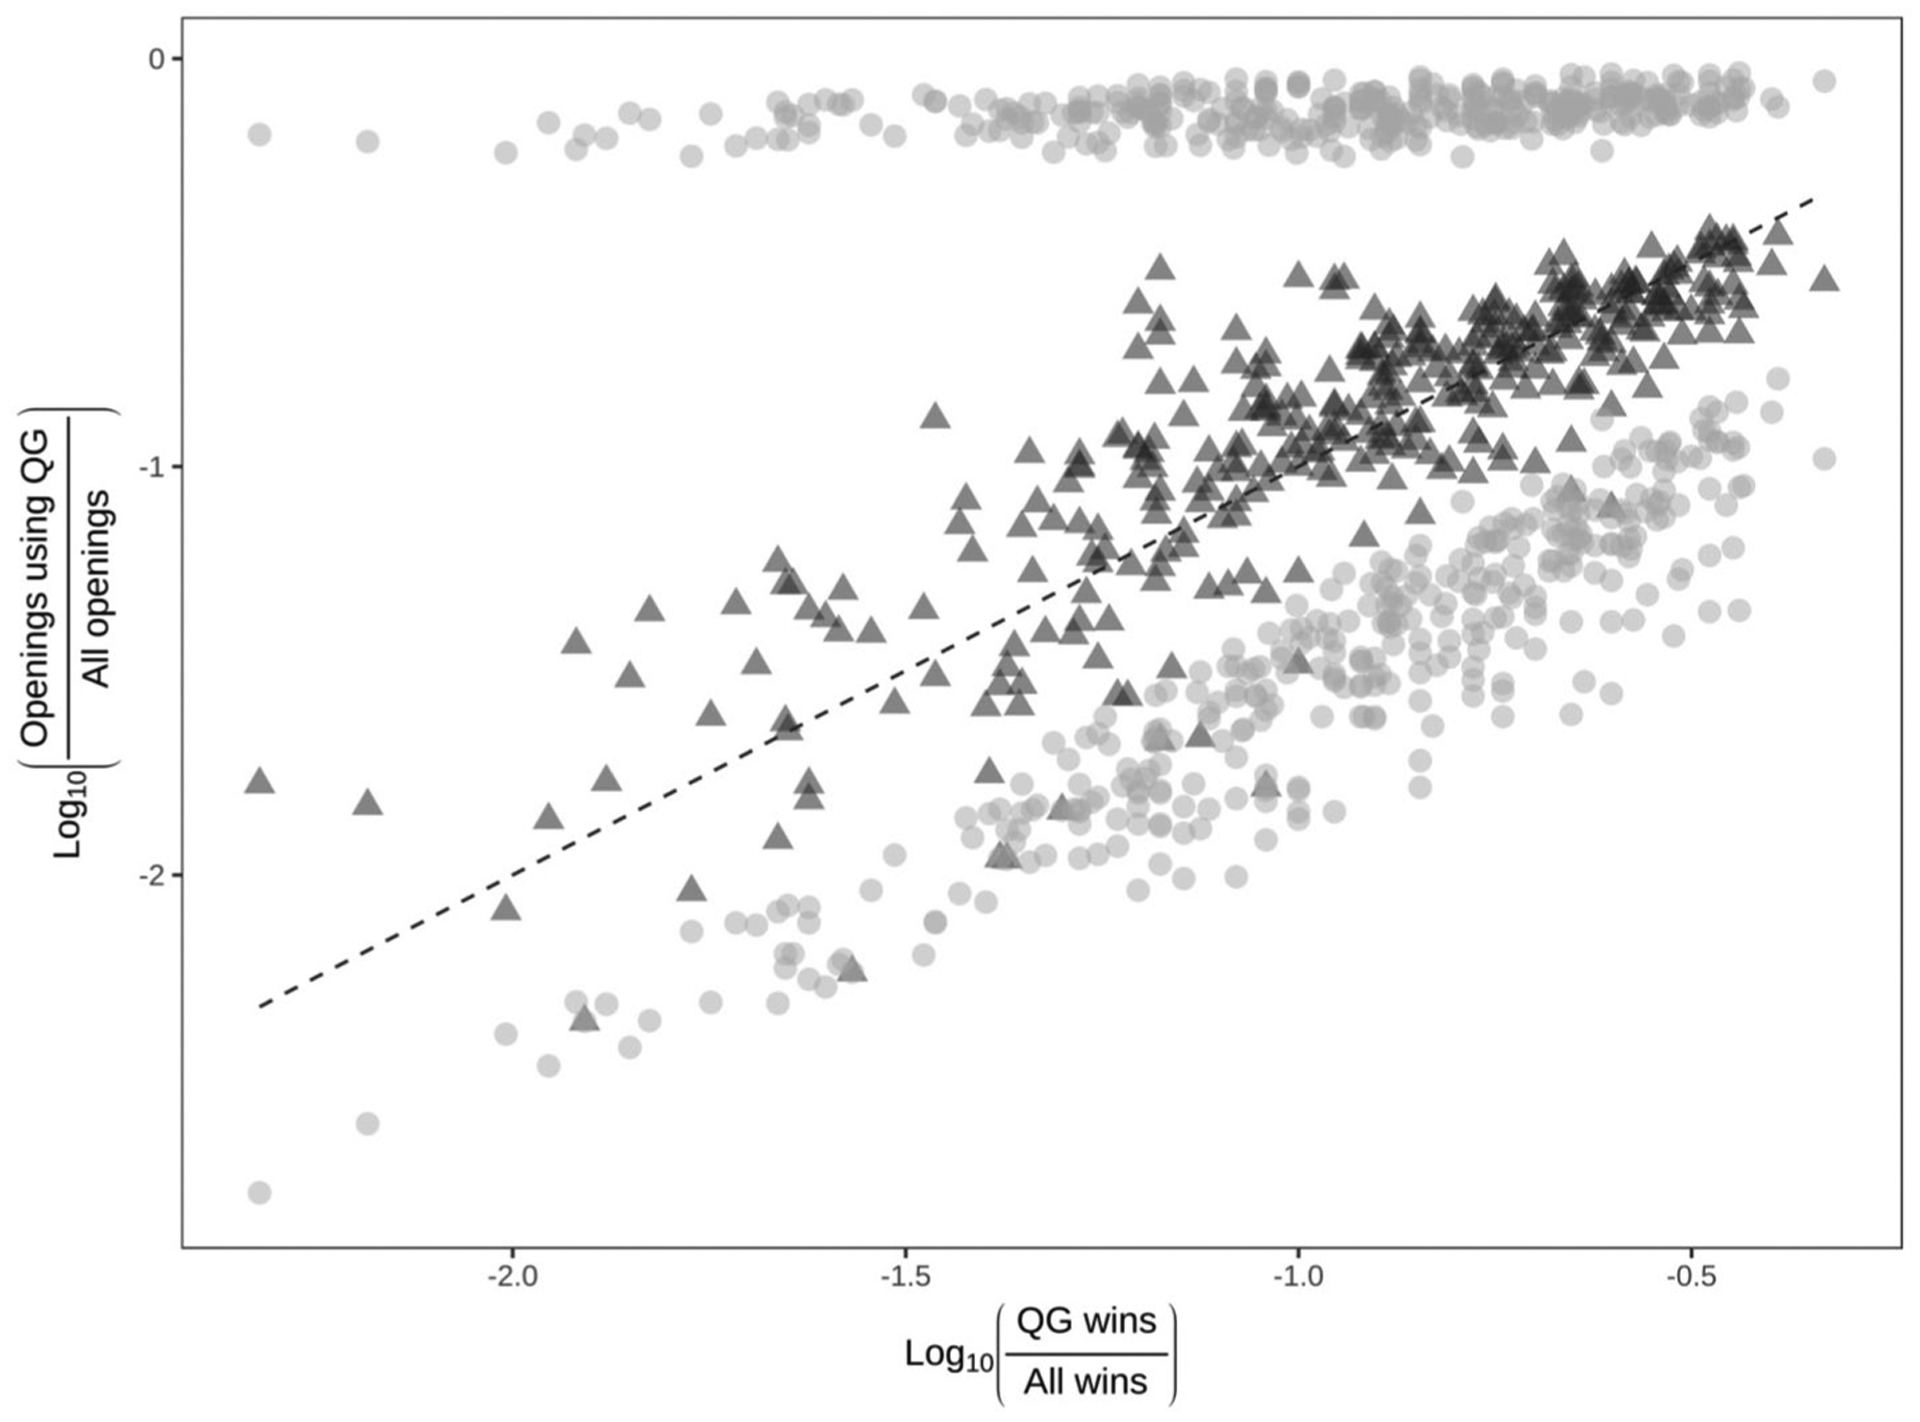
Figure 5.

Observed matching (dark triangles) by maximum and minimum possible matching (light circles) for each player. Optimal matching is given by the dashed line. Maximum and minimum possible matching were calculated using Equations 2 and 3 from Herrnstein (1970).
