
Figure 2.
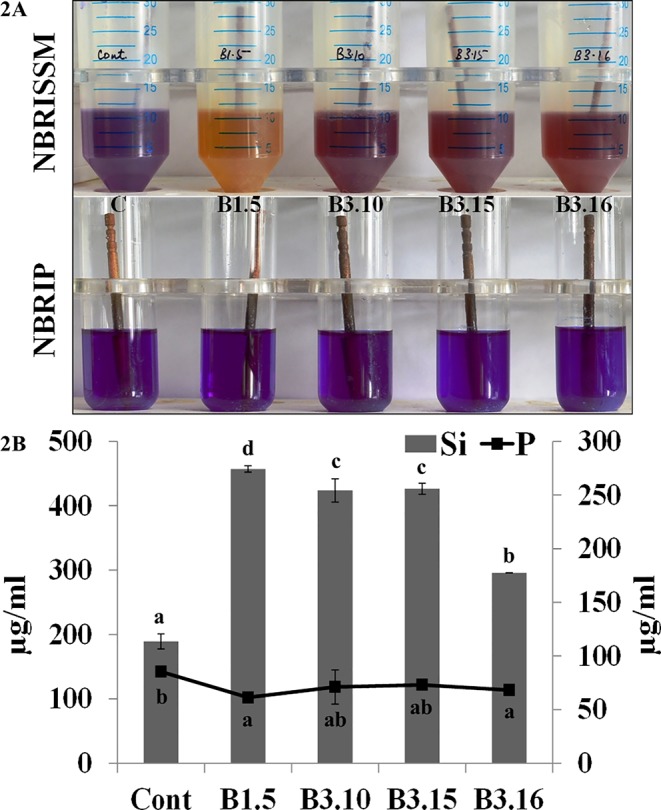
(A) Qualitative and (B) quantitative estimations of Si and P in NBRISSM and NBRIP medium. Results are the average of three independent experiments and vertical bars indicate mean ± S.D. of three replicates. Means followed by the same letter were not significantly different at p < 0.05.