Figure 2.
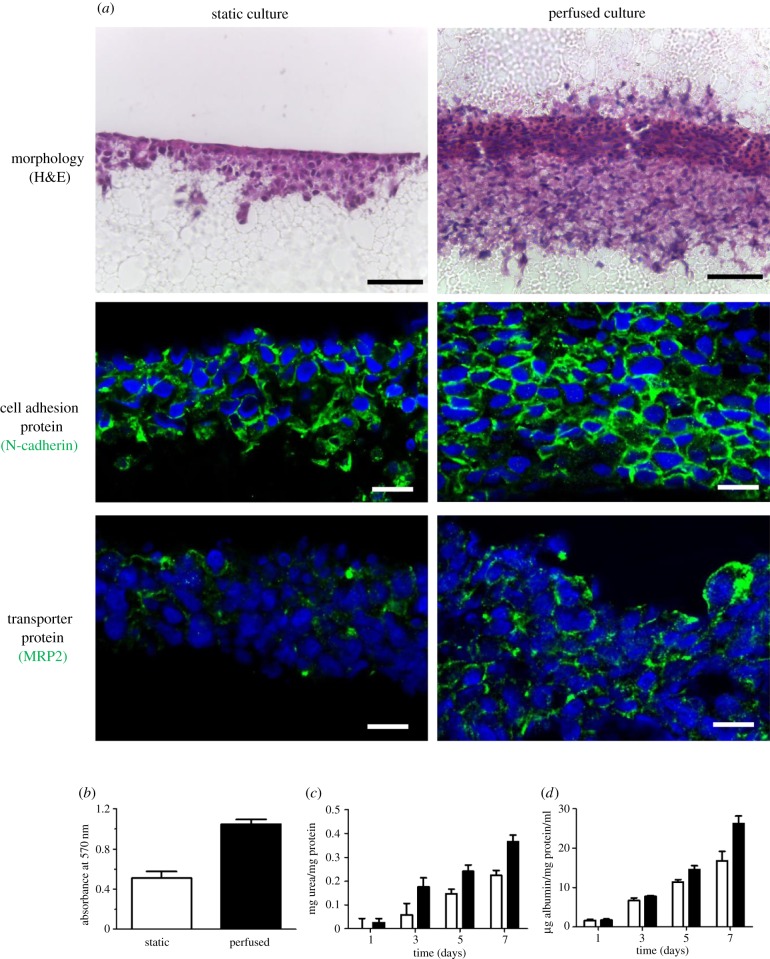
Analysis of HepG2 cultures grown in perfusion compared with static culture. After 2 days in static culture, HepG2 cells were either kept in these conditions or made into a sandwich culture and grown in the perfusion system for a further 7 days. (a) H&E staining shows an increase in tissue thickness in perfusion alongside greater invasion into the Alvetex Strata, while immunofluorescent staining of N-cadherin shows a high level of cell–cell junctions and expression of MRP2 shows greater specificity and localization in perfused cultures compared with static. Scale bars are 50 µm for H&E and 10 µm for immunofluorescence images. (b) MTT assay indicates that the viability of cells is increased under perfused conditions. White columns are static cultures, while black columns are perfused cultures. (c,d) Urea and albumin assays, respectively, show increased activity when in perfusion, reflecting greater levels of functionality in dynamic 3D culture. Values are mean ± standard error of the mean, n = 3 for the urea and albumin assays while n = 6 for the MTT assay.

