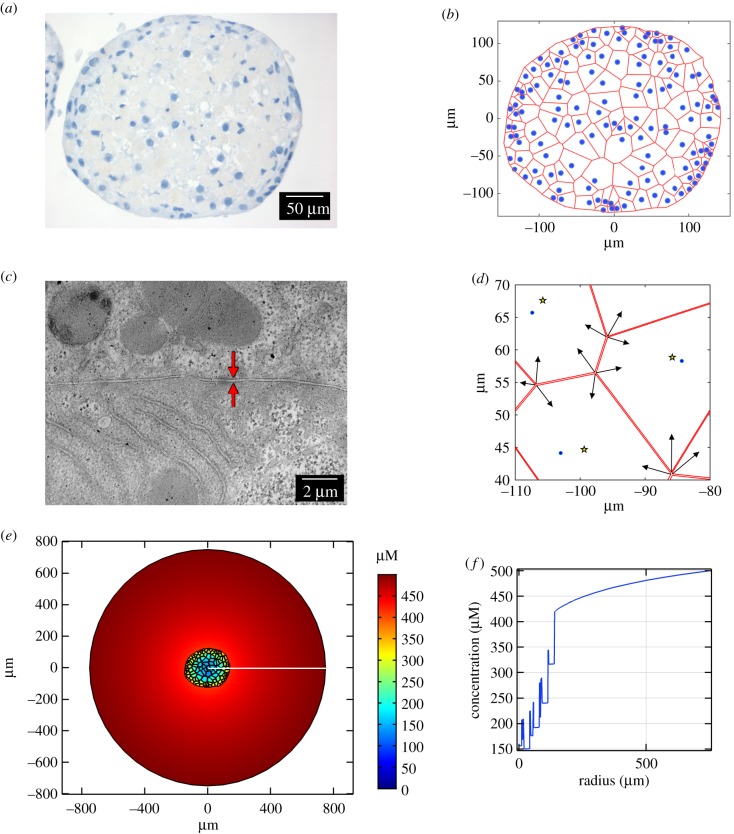
Figure 2.
The multiscale model including hepatocyte geometry. (a) Histological staining of a hepatocyte spheroid slice indicating the location of cell nuclei (blue). (b) Voronoi diagram constructed to provide estimates of hepatocyte boundaries (red) based on the location of hepatocyte nuclei (blue). (c) Representative TEM image of a hepatocyte spheroid showing the size of the space between adjacent cells. The intercellular space is indicated by the red arrows. (d) Intercellular space was introduced into the model geometry by contracting the vertices of Voronoi cells (indicated by black arrows) towards the centre of each cell (yellow stars; nuclei in blue). (e) Steady-state distribution of an example drug (logD7.4 = 3 with default parameters and wide intercellular space), formed with a constant supply of 500 µM at the outer media boundary (disc of radius 750 µm). The drug distribution is denoted by the colour bar, demonstrating that there are lower drug concentrations in the central hepatocytes. (f) A one-dimensional cross-section of the simulation (position indicated by the white line in (e)) signifies the variation of drug concentration inside and outside of the cells within the spheroid structure, as well as the heterogeneity of intracellular drug concentration in different regions of the spheroid.

