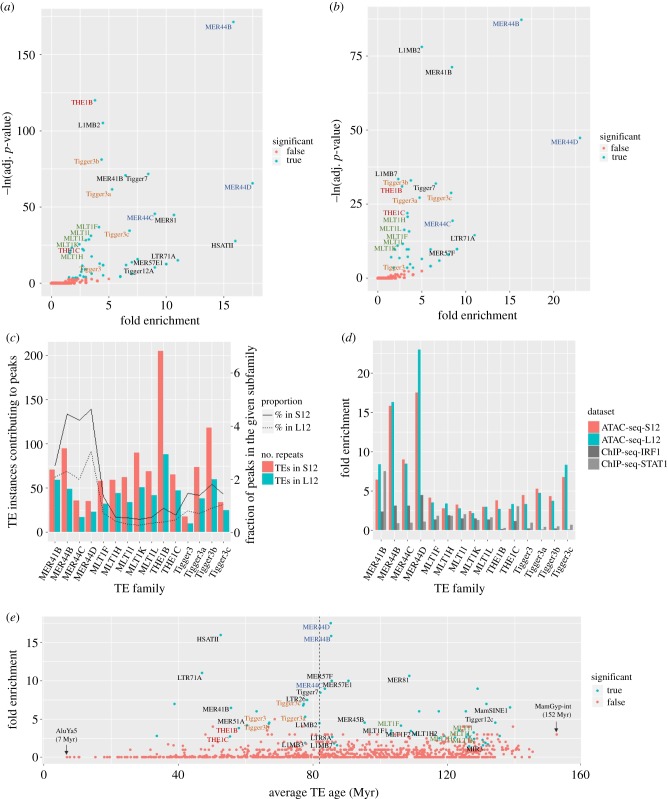
Figure 1.
TE enrichment in ATAC peaks by repeat subfamily in (a) S12 samples and (b) L12 samples. Significant families are represented by blue points (q-value < 0.05) and the remaining families by red. The coloured labels match the related families they belong to (blue for MER44, red for THE1, orange for Tigger3 and green for MLT1). adj., adjusted. (c) The absolute number of TE instances (bars) and the fraction of all instances in each subfamily (lines) contributing to accessible chromatin. (d) Comparison of TE enrichment results in our ATAC-seq peaks and the ChIP-Seq datasets published by Chuong et al. [7]. (e) Average age of TE instances for each repeat subfamily. Only the 34 immune families are labelled, with the coloured labels belonging to the 14 most interesting families. Dashed line marks the primate/rodent divergence time, 82 Ma [12].

