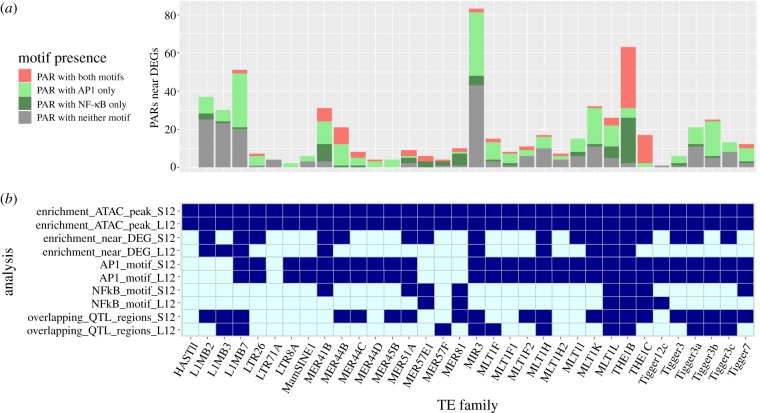
Figure 3.
(a) Number of PARs within 100 kb of a DEG that overlap either only AP-1 motifs, the NF-κB motif, both or neither motif. Note that nearly all MER41B, MER44 and THE1 repeats near DEGs overlap at least one of the two motifs. (b) Summary of all results for the 34 immune TE subfamilies. Enrichment is indicated in dark blue. Enrichment of the AP-1 and NF-κB motifs is defined as p-value < 0.05 in HOMER, motif found in at least 30% of PARs and a difference of at least 20% in accessible versus inaccessible repeats. The bottom two rows indicate if the subfamily has at least one PAR overlapping a QTL-region.

