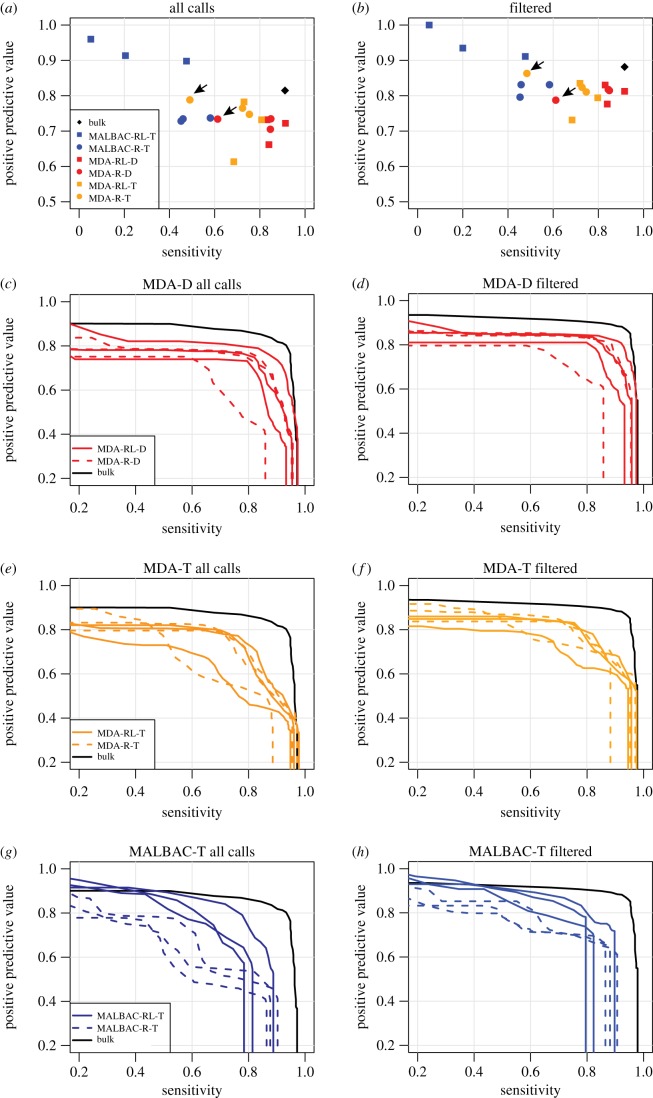
Figure 3.
Comparison to ‘gold standard’ known insertions. Sensitivity and PPV when comparing single-cell TIPseq to a set of known GM12878 insertions with intact primer binding sites. (a) Sensitivity and PPV for all experiments, including all insertions and using a probability cut-off of 0.9. (b) As (a), but including only insertions that pass our three filters. Diamond, bulk DNA TIPseq; circle, WGA using random hexamers only (R); square, whole-genome amplification using random hexamers and L1 primer (RL). Arrows indicate the MDA sample included in the vectorette PCR (both MDA-D and MDA-T) and next-generation sequencing stages that had less than perfect QC (corresponds to the same sample indicated in figure 2). (c–h) Sensitivity–PPV curves for each single-cell TIPseq experiment as the probability cut-off is varied from 0 to 1. Black lines, bulk DNA TIPseq; red, MDA WGA followed by restriction enzyme digestion and ligation with vectorette adaptors (MDA-D); orange, MDA WGA followed by end repair, dA tailing and ligation with dT vectorette adaptor (MDA-T); dark blue, MALBAC WGA followed by ligation with dT vectorette adaptor (MALBAC-T).

