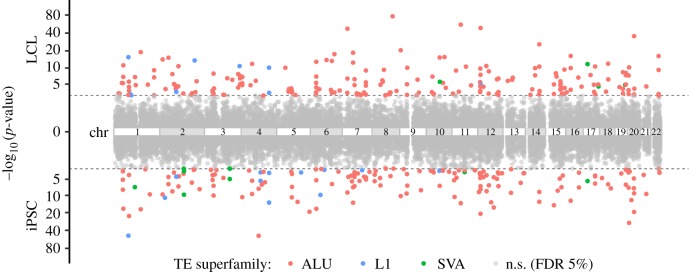
Figure 1.
Manhattan plots of TE-eQTL p-value significance [−log10(p-value)] in LCL (up) and iPSC (down). p-values are represented according to chromosomal position of TE-eQTL mapped in LCL (up) and in iPSC (down) TE-eQTL. The grey dashed lines represent the 5% false discovery rate (FDR) cut-off values (LCL: 1.21 × 10⁻³; iPSC: 2.18 × 10⁻³). Each p-value is coloured according to the TE family. n.s., not significant. (Online version in colour.)

