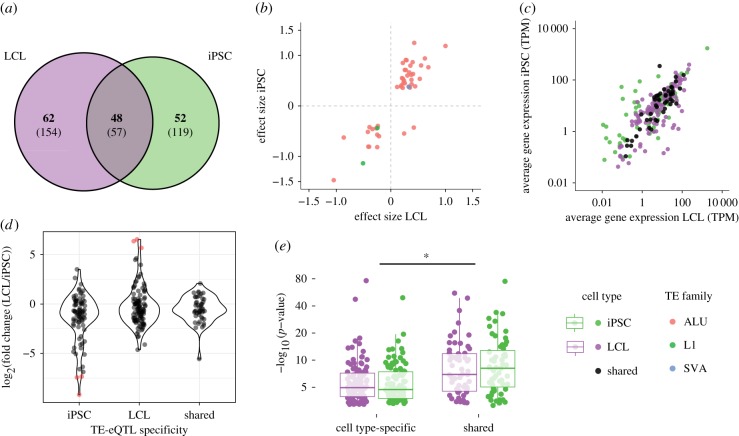
Figure 4.
TE-eQTL sharing between cell type. (a) Venn diagram representing the intersection of the total (in parentheses) and significant (in bold) number of eQTL discovered in LCL and iPSC. (b) Relationship between the effect size of shared eQTL between LCL (x axis) and iPSC (y axis). (c) Relationship between average gene expression in LCL and iPSC for shared and cell type-specific eGenes. TPM, transcripts per million. (d) Comparison of gene expression fold change between cell type-specific and shared eGenes; red dots indicate eGenes with more than mean fold change of ±3 s.d. (e) Comparison of p-value distributions between cell type-specific and shared TE-eQTL. Significance: ANOVA, *p < 0.05. (Online version in colour.)

