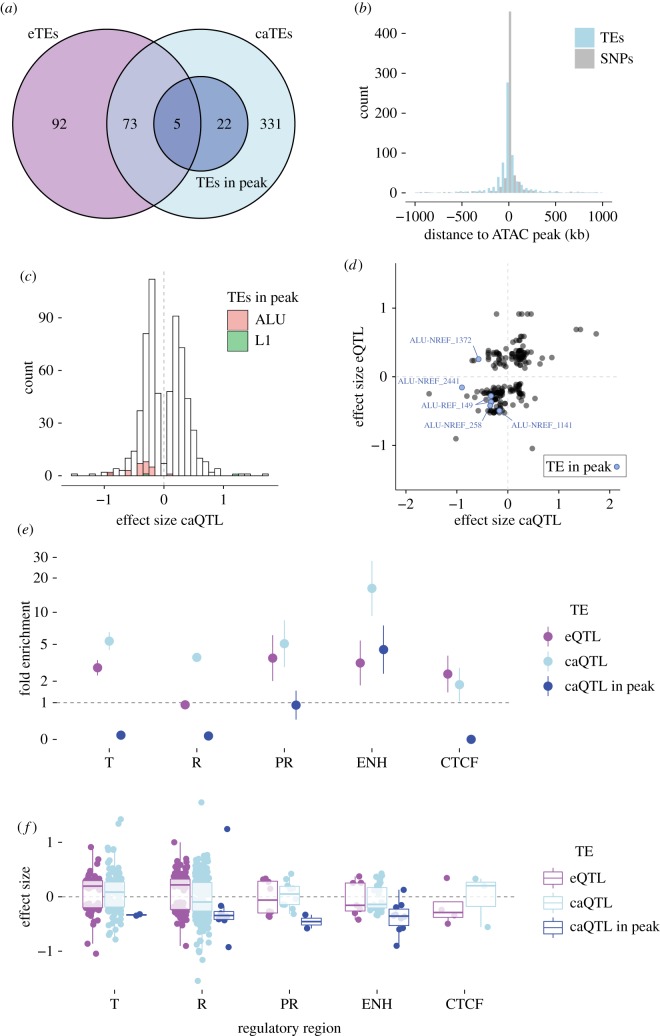
Figure 5.
Chromatin accessibility QTL in LCL (TE-caQTL). (a) Venn diagram representing the overlap between eTEs, caTEs and caTEs directly mapping in the associated ATAC peak. (b) Distribution of the TE-caQTL size effect. Families of caTEs inserted directly within the associated ATAC peak are coloured according to the key. (c) Distribution of the distance between caTE and their associated ATAC peaks. (d) Relationship between eQTL and caQTL effect sizes for 78 TEs involved in the two QTL. Blue dots are caTEs inserted in the associated ATAC peak. (e) Enrichments of eTEs and (f) effect size of TE-eQTL in different regulatory regions according to the ChroMM + Segway integrated track generated for one of the LCL (GM12878). Error bars indicate ±1 s.d. T: transcribed region; R: repressed region; PR: promoter (includes transcription start site); ENH: enhancer; CTCF: CTCF binding site. (Online version in colour.)

