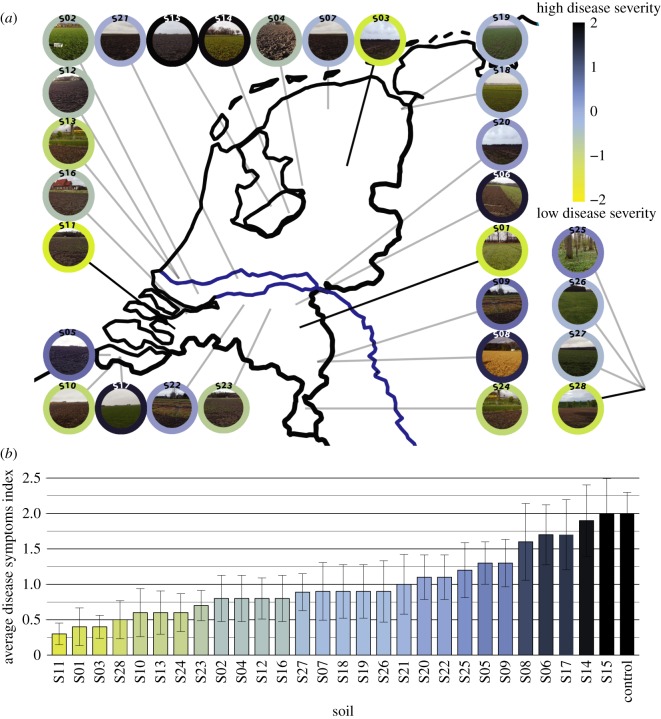
Figure 2.
Results of the phenotypic screening towards soil suppressiveness to F. culmorum in 28 soils. (a) Map showing locations of 28 sampling sites and the results of the screening. The colour of the outer circle around the photos represents the z-score transformed average disease symptoms value. Low disease severity indicates soil suppressiveness (yellow colour). (b) Bar graph showing average disease symptoms indexes with standard errors. (Online version in colour.)

