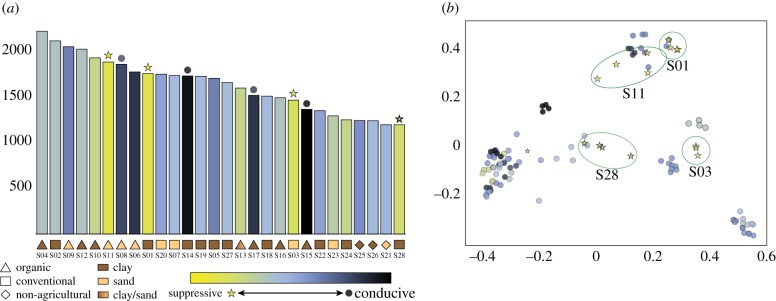
Figure 4.
Characteristics of rhizosphere bacterial communities across all 28 soils. (a) Bar plot representing the alpha diversity using the rarefied unique ASV counts. Samples are sorted according to their alpha diversity score and colour coded according to suppressive phenotype. (b) PCoA based on unweighted UniFrac distance between samples. Circles highlight the suppressive sample replicates clustered together. (Online version in colour.)

