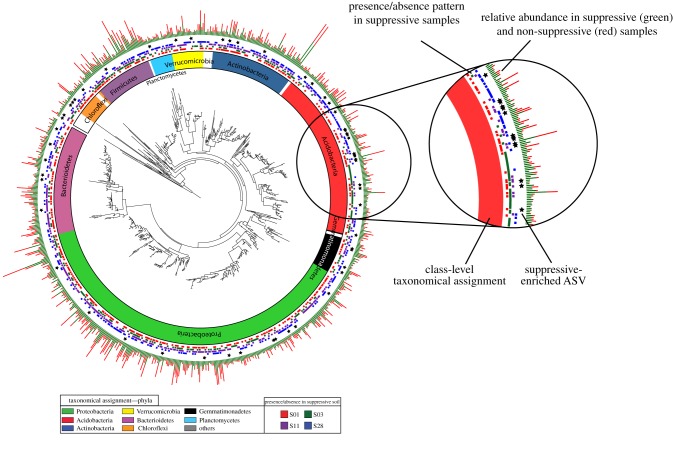
Figure 5.
Phylogenetic tree of all ASVs consistently detected in one or more suppressive rhizosphere samples. The rings, from the inside to the outside, represent (1) the taxonomical assignment of the ASVs at the phylum level, (2) the presence/absence patterns of ASVs in the four different suppressive soils, (3) indications (with stars) of ASVs strongly enriched in suppressive samples and (4) the average cumulative normalized abundance of each ASV in suppressive (green) versus non-suppressive (red) samples. The results show that all ASVs enriched in suppressive samples are specific to a subset of the suppressive soils, while none of the ASVs that occur throughout all suppressive soils are significantly enriched in suppressive versus non-suppressive soils. (Online version in colour.)

