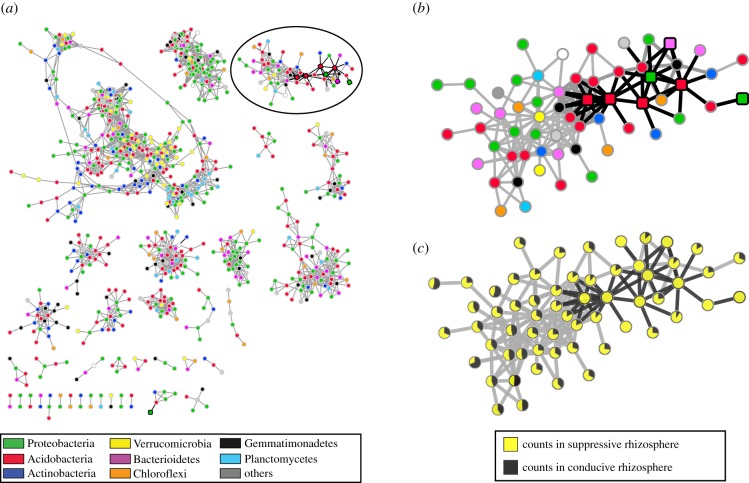
Figure 6.
Co-occurrence network analysis of rhizosphere bacteria across samples. (a) Complete network of correlated ASVs using Spearman correlation. Nodes represent individual ASVs; edges link ASVs which had a correlation score above a given threshold. The node colour indicates the taxonomical annotation at the phylum level. Edges of ASVs that are significantly enriched in suppressive samples are highlighted black as the respective nodes. (b) Zoomed in view of a subnetwork of interest, which shows a number of ASVs associated with the suppressive phenotype indicated by squares with black border, along with its taxonomical distribution. (c) Normalized counts ratio between conducive (yellow) and suppressive (black) samples for ASVs from the network in (b). (Online version in colour.)

