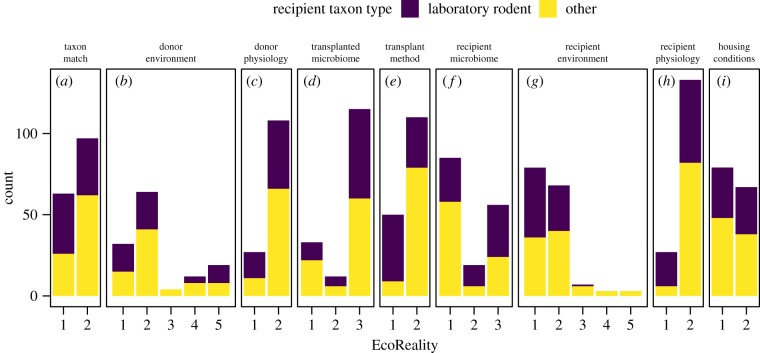
Figure 3.
Number of transplant instances in each experimental condition, separated into whether the recipient animal was a laboratory rodent or another animal. The x-axis is the level of EcoReality, with 1 always the lowest EcoReality. The levels are explained in the electronic supplementary material, table S1. (Online version in colour.)

