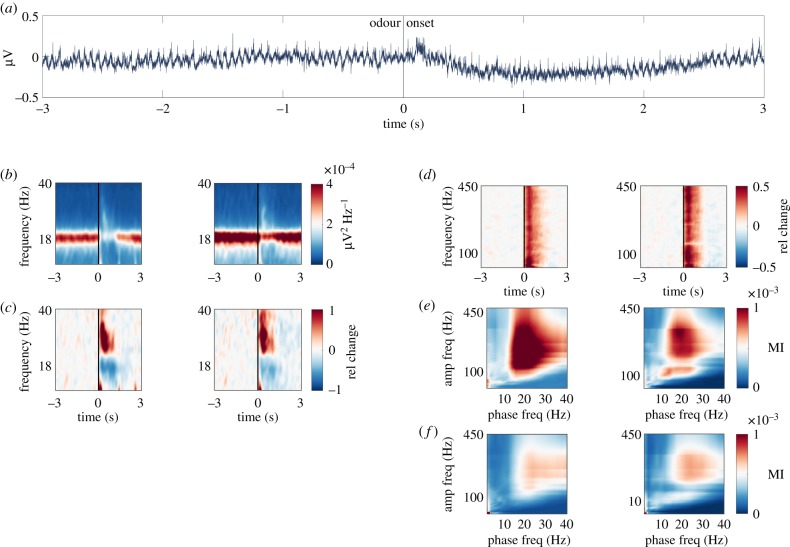
Figure 1.
Spontaneous alpha and odour-induced gamma oscillations in the mushroom bodies. (a) Raw trace of a single trial in a representative bee. Odour is presented at 0 s. (b) Time-frequency (5–40 Hz, alpha and low gamma) representation of raw power (colour-coded, µV2 Hz−1) recorded in the left (left) and right hemisphere (right), respectively. A 1 s long odour stimulus was presented at 0 s. n = 9 bees (stimulations per bee mean/s.d. 53/29). (c) The same as in (b) baseline-corrected. Warm colours indicate increase and cold colours decrease in oscillatory power expressed as relative change from pre-stimulus baseline. (d) Same as in (c) but for higher frequencies (40–450 Hz, high gamma). (e) Cross-frequency phase-to-amplitude coupling. Bispectra illustrating cross-frequency relationships in the left and right hemisphere, respectively. The phase-providing frequency is depicted on the x-axis and amplitude-providing frequency on the y-axis. Colour code shows the modulation index (MI). (f) Same as (e) but during odour stimulation. (Online version in colour.)

