Figure 2.
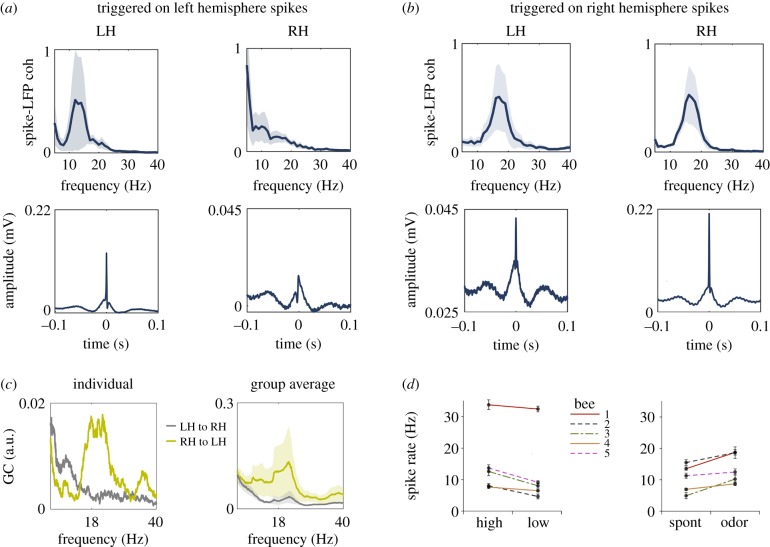
Neuronal spikes are phase-locked to the alpha oscillation. (a) Spike-triggered averages computed on left hemisphere spikes. Top: coherence between spikes and LFPs computed over the spike-triggered averages shows an approximately 18 Hz peak in the spectrum (mean and s.e.m., n = 5 bees). Bottom: spike-triggered averages for the left (LH) and right hemisphere (RH), respectively. Spike onset is at 0 s. n = 5 bees (spikes per bee mean/s.d. 4441/2415). (b) Same as (a) computed on right hemisphere spikes. (c) Granger causality spectra for an individual bee (left) and the group average (right) indicates stronger Granger causality (GC) influence from the right hemisphere (RH) to the left hemisphere (LH) (n = 9 bees, line represents the mean, the shaded area the s.e.m., right panel). (d) Left: spike rate per bee for high and low alpha power. Points and error bars show the mean and s.e.m. over trials. Values show the number of spikes per second. Right: spike rate per bee during spontaneous activity (during 2–1 s before odour onset) and odour-induced activity (during 0.1–1.1 s after odour onset). (Online version in colour.)

