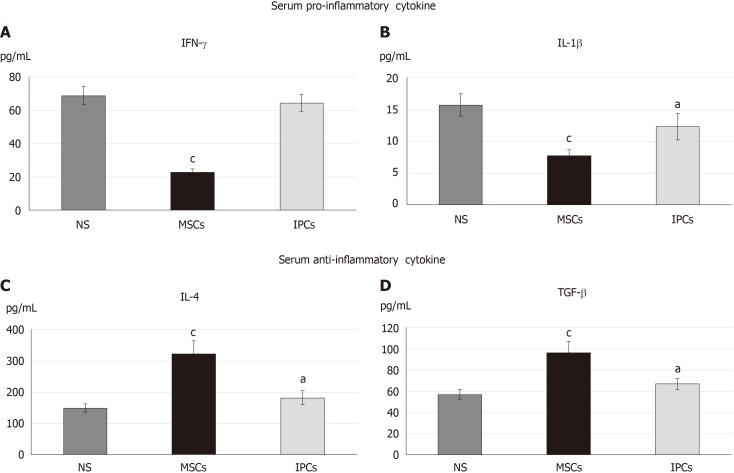
Figure 4.
Comparison of the serum cytokine profile in the different treatment groups of diabetic rats. aP < 0.05, P < 0.05 when compared with the serum concentration of the normal saline (NS) group. cP < 0.05, P < 0.05 when comparing the serum concentration between the mesenchymal stem cell (MSC) group and insulin-producing cell (IPC) group. NS: Normal saline treatment group; MSCs: Undifferentiated Wharton’s jelly mesenchymal stem cells treatment group; IPCs: Insulin-producing cells treatment group.

