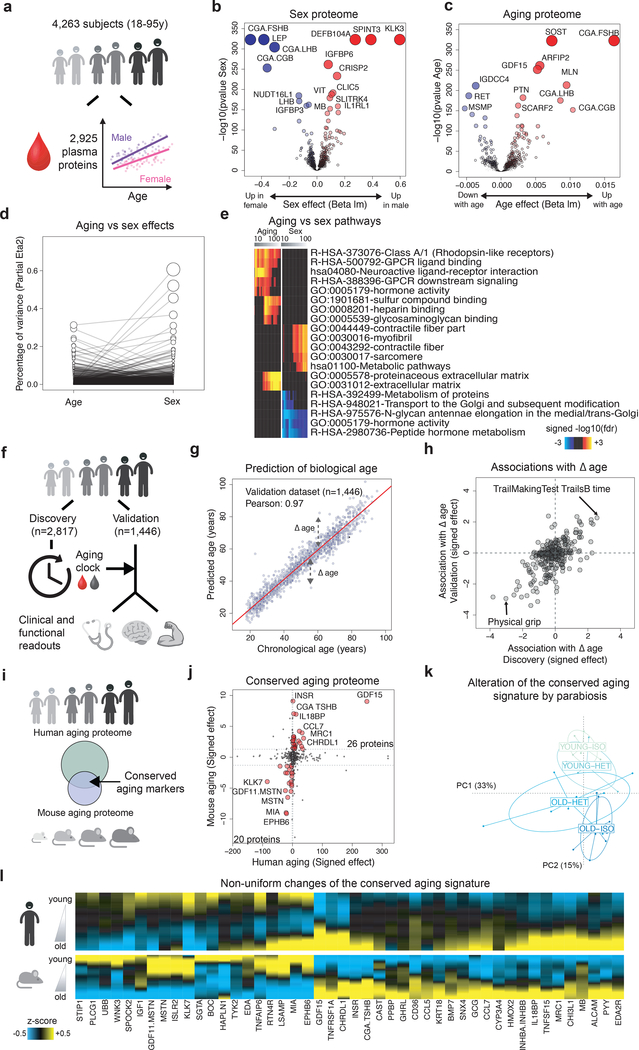
Figure 1: Linear modeling links the plasma proteome to functional aging and identifies a conserved aging signature.
(a) Schematic representation of analysis of the plasma proteome.
Volcano plots representing changes of the plasma proteome (n=4,263) with sex (b) and age (c). Linear models, adjusted for age, sex and subcohort were tested using F-test.
(d) Relative percentage of variance explained by age and sex. Values for each plasma protein are connected by edges.
(e) Pathways associated with sex and age identified by Sliding Enrichment Pathway Analysis (SEPA, n=4,263). Proteins upregulated and downregulated are analyzed separately. The top 10 pathways per condition are represented. Enrichment was tested using Fisher’s exact test (GO) and hypergeometric test (Reactome and KEGG).
(f) Schematic representation of the of biological age modeling using the plasma proteome.
(g) Prediction of age in the validation cohort (n=1,446) using 373 plasma proteins. Pearson correlation coefficient between chronological and predicted age is indicated.
(h) Association between delta age (difference between chronological age and chronological age) and functional readouts in old. Top associations in both Discovery and Validation datasets are represented.
(i) Schematic representation of the comparison between the human and mouse aging proteomes.
(j) Conserved markers of aging. Both human and mouse aging effects are signed by the beta age of their corresponding linear analysis. Forty-six plasma proteins are changing in the same direction in mouse and humans (red dots) and define a conserved aging signature.
(k) Alteration of the conserved aging signature by parabiosis. Normed principal component analysis was used to characterize changes of the conserved aging signature when mice are exposed to young or old blood.
(l) Age-related changes of the conserved aging signature. Plasma protein levels were z-scored and aging trajectories were estimated by locally estimated scatterplot smoothing.

