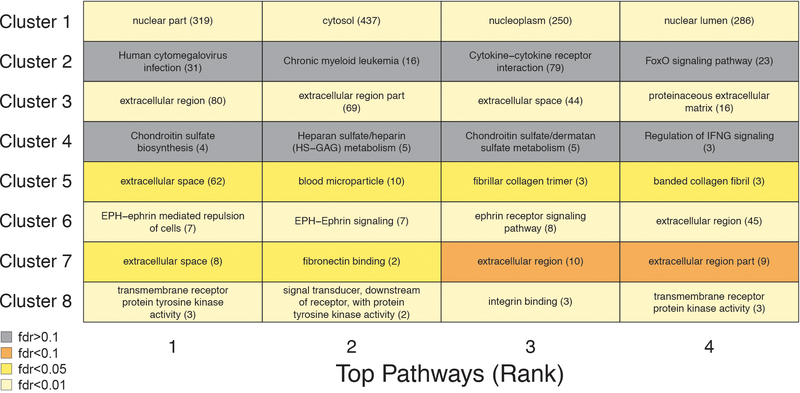
Extended Data Fig. 6. Pathways in clusters.
Pathway enrichment was tested using GO, Reactome and KEGG databases (n=4,263). Enrichment was tested using Fisher’s exact test (GO) and hypergeometric test (Reactome and KEGG). The top 4 pathways for each cluster are shown. Pathway IDs and number of plasma proteins associated are represented in the table.

