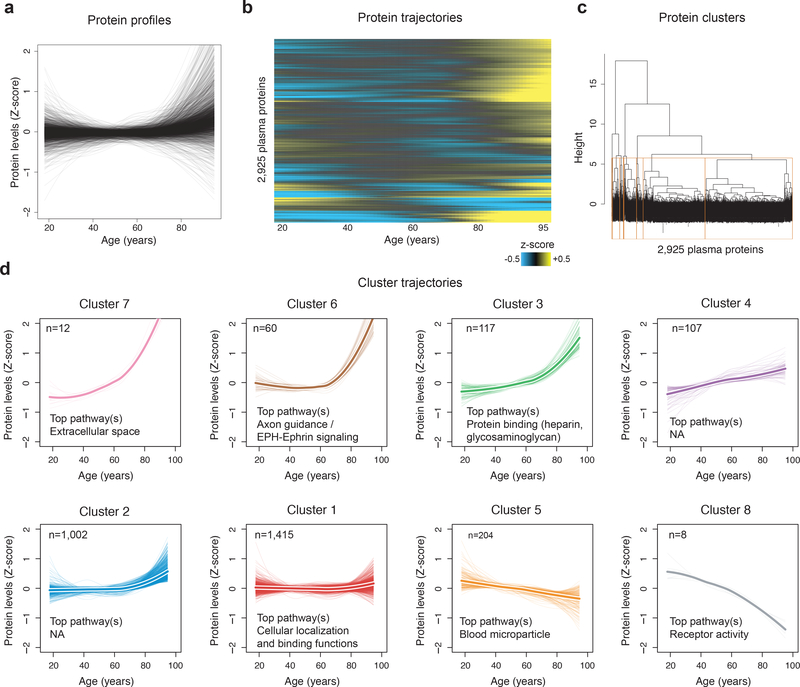
Figure 2: Clustering of protein trajectories identifies linear and non-linear changes during aging.
(a) Protein trajectories during aging. Plasma protein levels were z-scored and trajectories of the 2,925 plasma proteins were estimated by LOESS.
(b) Trajectories are represented in two dimensions by a heatmap and unsupervised hierarchical clustering was used to group plasma proteins with similar trajectories.
(c) Hierarchical clustering dendrogram. The 8 clusters identified are represented by orange boxes.
(d) Protein trajectories of the 8 identified clusters. Clusters are grouped by the similarity of global trajectories, the thicker lines representing the average trajectory for each cluster. The number of proteins and the most significant enriched pathways are represented for each cluster. Pathway enrichment was tested using GO, Reactome and KEGG databases. The top 20 pathways for each cluster are listed in Supplementary Table 12.

