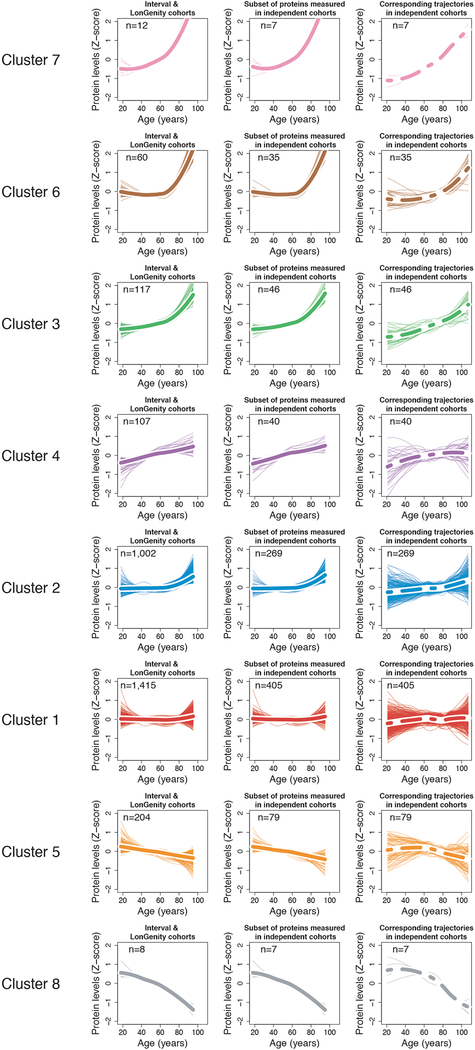
Extended Data Fig. 5. Cluster trajectories in independent cohorts.
Protein trajectories for the 8 clusters identified in the INTERVAL and LonGenity cohorts (left column). Thicker lines represent the average trajectory for each cluster. Cluster trajectories for the subset of proteins measured in the 4 independent cohorts (middle column). Corresponding cluster trajectories in 4 independent cohorts (right column).

