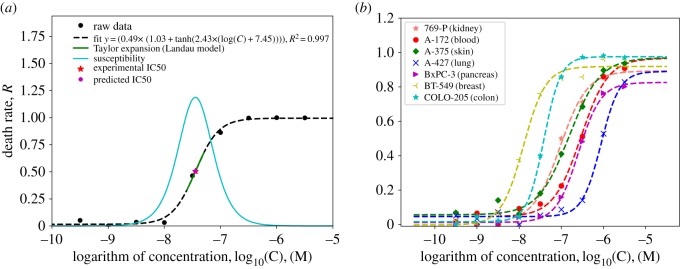
Figure 2.
(a) Profile of the death rate in terms of the logarithm of the drug concentration for the melanoma A375 cell line in the exposure of Bortezomib drug. Dashed line represents the fit to equation (3.1), the solid line in cyan is the corresponding susceptibility, the red star represents the experimental IC50, the purple circle shows the predicted IC50 value from our fitting function and the solid green line shows the Taylor expansion around the coefficient d. (b) Profile of the death rate in terms of the of Paclitaxel drug for different cell lines.

