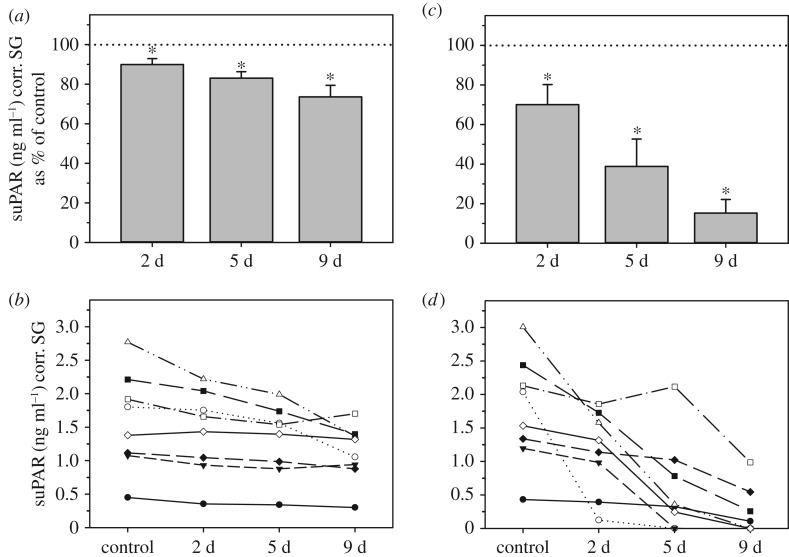
Figure 4.
Effect of fridge- (left graphs; a,b) or room temperature storage (right graphs; c,d) on urinary suPAR concentrations. Urinary suPAR concentrations are shown as percentage (mean ± s.e.m.) of control values (100%, dotted line; a,c), and absolute concentrations (b,d). For each treatment, an asterisk indicates concentrations that differ significantly from controls. d = days of storage.

