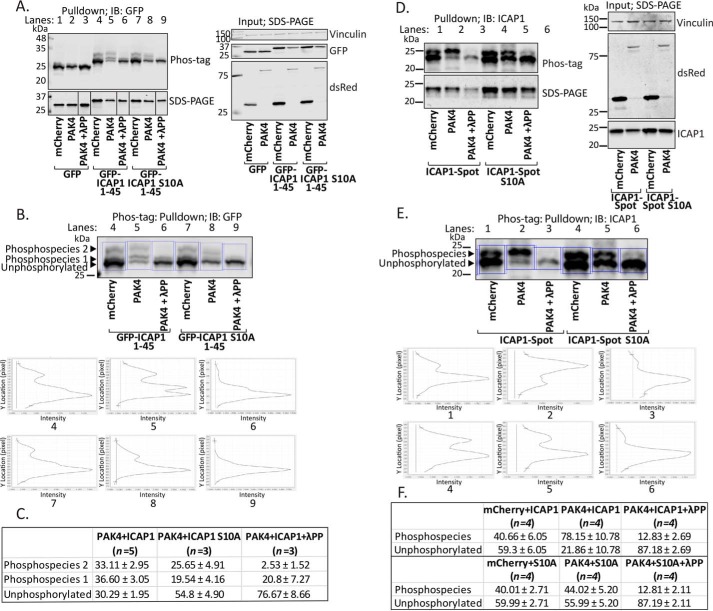
Figure 8.
Activated PAK4 phosphorylates ICAP1 Ser-10 in cells. Phos-tagTM gel mobility shift analyses were performed in CHO cells co-expressing mCherry, mCherry-PAK4 S445N, and either GFP, GFP-ICAP1 1–45, or GFP-ICAP1 1–45 S10A (A–C) or ICAP1-Spot or ICAP1-Spot S10A (D–F) in the presence and absence of λ-protein phosphatase (λPP). A–C, GFP-nanotrap pulldowns were resolved by Phos-tagTM PAGE and by standard SDS-PAGE (as indicated) and analyzed by immunoblotting (IB) against GFP (A). Input samples were also assessed by standard SDS-PAGE to evaluate expression levels of all constructs. B, line scans (outlined by blue boxes) depicting signal intensities of mobility shift bands of GFP-ICAP1 1–45 or GFP-ICAP1 S10A 1–45 from A in conditions with mCherry, mCherry-PAK4 S445N alone, or mCherry-PAK4 S445N with λ-protein phosphatase. C, percentages of the signal in each of the mobility shift bands of GFP-ICAP1 1–45 or GFP-ICAP1 S10A 1–45 were calculated by dividing the signal intensity of each band by the total amount of ICAP1. Data are represented as mean ± S.D. from independent preparations. D–F Spot-Trap® agarose pulldowns were resolved by Phos-tagTM PAGE and by standard SDS-PAGE and analyzed by immunoblotting against ICAP1 (D). Input samples were also assessed by standard SDS-PAGE to evaluate expression levels of all constructs. E, line scans (outlined by blue boxes) depicting signal intensities of mobility shift bands of ICAP1-Spot or ICAP1-Spot S10A from D in conditions with mCherry, mCherry-PAK4 S445N alone, or mCherry-PAK4 S445N with λ-protein phosphatase. F, percentages of the signal in each of the mobility shift bands of ICAP1-Spot or ICAP1-Spot S10A were calculated by dividing the signal intensity of each band by the total amount of ICAP1. Data are represented as mean ± S.D. from independent preparations. Uncropped immunoblots are shown in Fig. S3.

