
Figure 1.
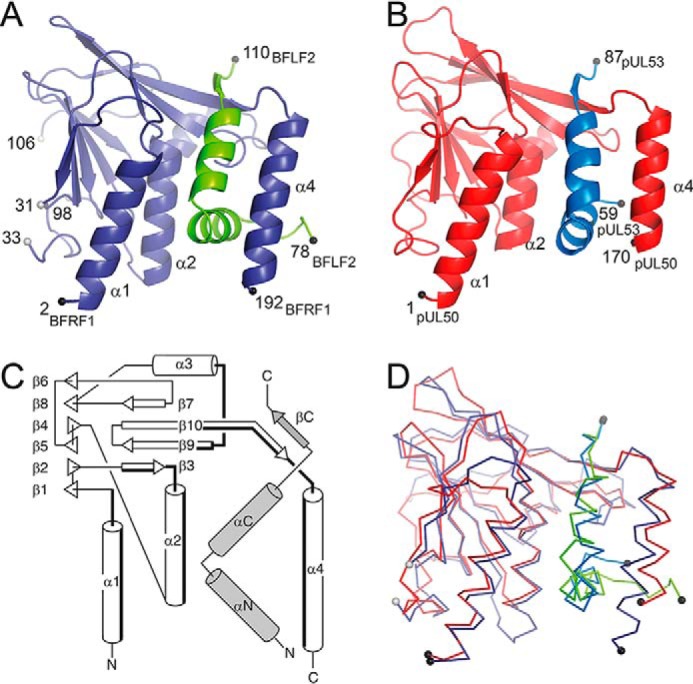
Crystal structures of the EBV BFRF1-BFLF2 and HCMV pUL50-pUL53 complexes. A, ribbon representation of BFRF1 (in prune) in complex with the hook segment of BFLF2 (green). B, ribbon representation of pUL50 (red) in complex with the hook segment of pUL53 (blue). C, common topology plot of the complexes with the secondary structure elements from the hook segment indicated in gray. The secondary structure elements that participate in the binding of the hook segment are lined in bold. D, superposition of the EBV BFRF1-BFLF2 and HCMV pUL50-pUL53 complexes.