Figure 3.
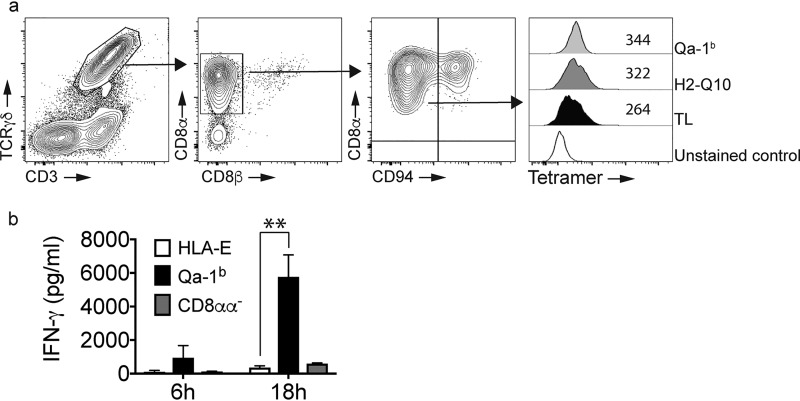
MHC-Ib binds CD8αα on γδT cells with Qa-1b inducing IFN-γ production. a, the pattern of MHC-Ib binding to CD8αα γδT cells is similar to that observed for RMA-s–CD8αα cells. FACS analysis of small intestine identifies a population of CD8αα+/CD94− γδT cells that bind MHC-Ib tetramers. Contour plots show the staining for CD3+/γδTCR+ cells (left panel), their expression of CD8αα and the delineation of CD8αα+/CD94− and CD8αα+/CD94+ subsets. The arrows show the pattern of electronic gating. Staining of TCRγδ+/CD8αα+/CD94− cells with TL, H2-Q10, and Qa-1b demonstrates increased binding of Qa-1b when compared with H2-Q10 and TL. The open histogram is unstained, the filled histogram is TL, the dark-shaded histogram is H2–10 and the light-shaded histogram is Qa-1b. Numbers in the histogram are the median fluorescent intensity. Results are representative of at least four independent experiments. All histograms have been offset to stack vertically above one another and scaled to maximum count for clarity. b, Qa-1b promotes CD8αα γδT cell activation. TCRγδ+/CD8αα+/CD94− cells were sorted from the small intestine and cultured in the presence of crosslinked HLA-E monomers (open bars) or Qa-1b monomers (filled bars). TCRγδ+/CD8αα−/CD94− cells sorted from the small intestine were cultured in the presence of crosslinked Qa-1b monomers (gray bars). At 6 and 18 h post stimulation, the supernatants were harvested and cytokine production assessed using a CBA. The data are pooled from two independent experiments performed in triplicate (n = 6). **, p = 0.0022.

