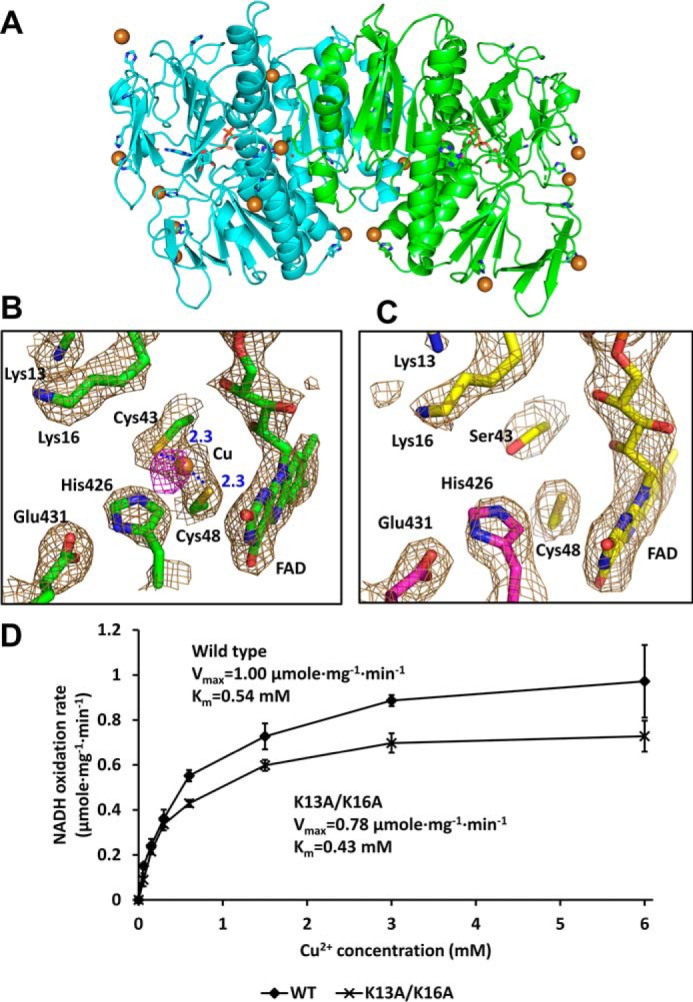
Figure 7.

Extra electron density maps at the active site in Cu2+-soaked structures. A, overall structure of the RclA WT in complex with Cu2+. Each subunit is colored differently (cyan and green). Cu2+ is shown in the sphere (brown). Histidine residues and the bound FAD are shown in the stick representation. B, binding of Cu2+ at the active site of the WT RclA protein. Each subunit is colored differently (cyan and green). Cu2+ is shown in the sphere (brown). The electron density map is contoured at 1.5 σ (sand). Anomalous difference map of the bound Cu2+ is contoured at 3.7 σ (magenta). Distances are in Å (blue dash). C, active site of RclA C43S. Each subunit is colored differently (yellow and magenta). The electron density map is contoured at 1.5 σ (sand). D, biochemical analysis of Lys-13 and Lys-16. Initial velocities of the NADH oxidation by RclA WT and RclA K13A/K16A were measured for Km and Vmax. The reactions were performed with 2 μm RclA in a buffer containing 200 μm NADH and 0, 0.6, 0.15, 0.3, 0.6, 1.5, 3, or 6 mm Cu2+. NADH oxidation rates were measured over time spectrophotometrically (n = 3, mean ± S.D.). The Vmax or Km value was calculated by fitting the data with a Michaelis-Menten equation using an enzyme kinetics tool of the SigmaPlot Version 14.0 (Systat Software, San Jose, CA).
