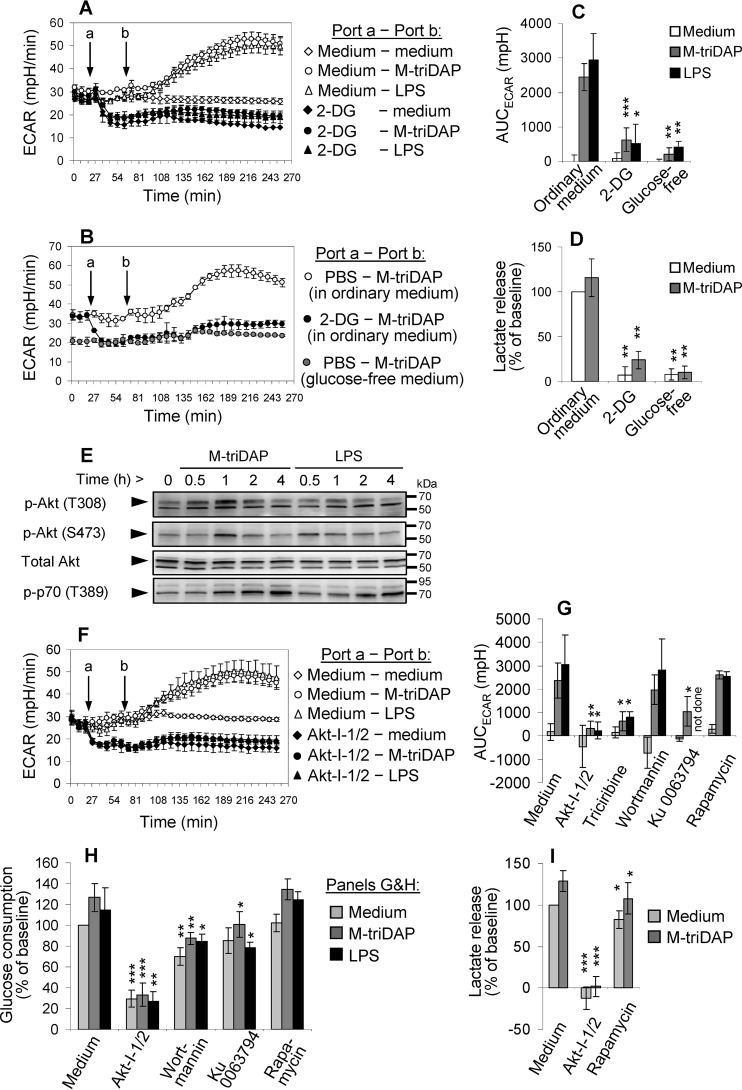
Figure 3.
Mechanisms of glycolytic reprogramming induced by M-triDAP or LPS in MDM. A, ECAR responses induced by M-triDAP (10 μg/ml) or LPS (100 ng/ml) in ordinary glucose-replete medium without or with pre-injection of 2-DG (50 mm). 1 representative experiment out of 5. B, comparison of ECAR responses induced by M-triDAP in ordinary medium without or with 2-DG or in glucose-free medium (1 experiment out of 3). C, AUC for ECAR curves shown in A and C (mean ± S.D. of 5 donors for 2-DG and 3 donors for glucose-free medium). D, 24-hour lactate release in the presence of 2-DG or in glucose-free medium (8 and 6 donors, respectively). E, kinetics of Akt and p70 phosphorylation in MDM upon M-triDAP or LPS treatment (1 representative experiment out of 3). Arrowheads indicate specific bands for Akt/p-Akt (60 kDa) and p-p70 (70 kDa). F, kinetics of ECAR after injection of Akt-I-1/2 (10 μm) and subsequent injection of M-triDAP or LPS (1 experiment out of 4). G–I, effects of inhibitors of Akt and upstream and downstream kinases on AUCECAR (G), 24-h glucose consumption (H), and 24-h lactate release (I) by MDM. MDM were pre-treated with Akt-I-1/2 (10 μm), triciribine (20 μm), wortmannin (100 nm), Ku 0063794 (1 μm), or rapamycin (10 nm), after which stimulated with medium alone, M-triDAP (10 μg/ml), or LPS (100 ng/ml). Mean ± S.D., 4 to 8 experiments per data point. In plots C, D, G–I, asterisks denote comparisons to cells treated with the same PRR agonist in the absence of inhibitors (*, p < 0.05; **, p < 0.01; ***, p < 0.001 by paired t test).

