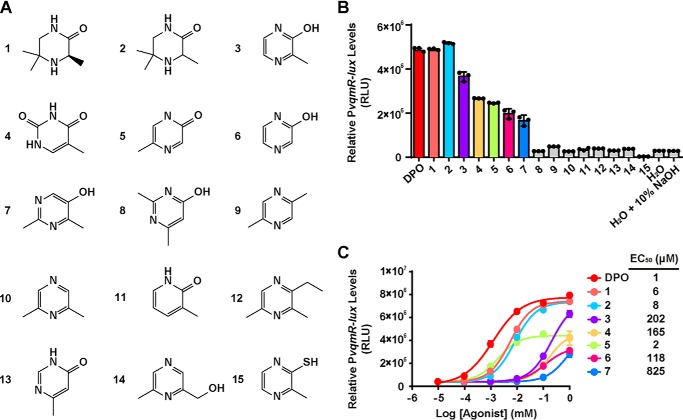
Figure 5.
Structure-activity relationship study of DPO. A, structure of DPO analogs studied here. B, responses of the PvqmR-lux reporter strain to 1 mm DPO and analogs. Shown are compounds exhibiting >25% of the maximal activity (colored bars) and <25% maximal activity (gray bars). C, dose-response analyses of DPO and active analogs from B using the PvqmR-lux reporter strain. Dose responses are depicted as curve fits with the raw data plotted as individual points. Data points in B and C are represented as means ± S.D. (error bars) with n = 3 biological replicates. RLU, relative light units.

