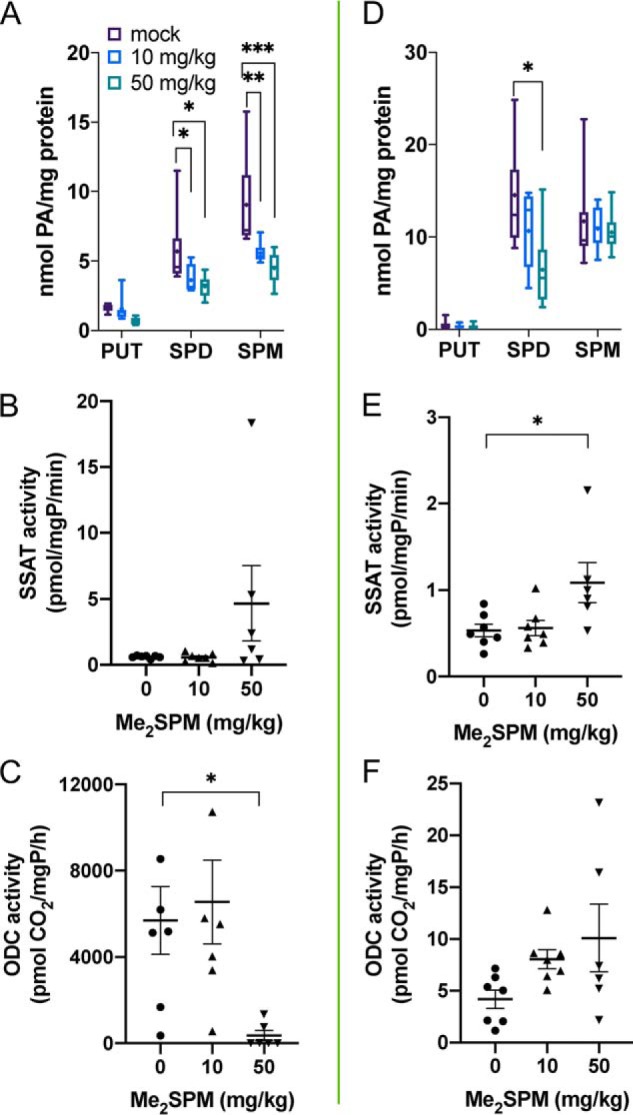
Figure 6.

Changes in polyamine levels and key metabolic enzyme activities in Me2SPM-treated mouse kidney (A–C) and liver (D–F). Tissues from treated mice were assayed for intracellular polyamine concentrations (A and D), SSAT (B and E), and ODC activities (C and F). The data points in B, C, E, and F indicate the averages of three determinations per mouse, relative to total protein, with horizontal lines indicating the means with S.E. The data in A and D represent duplicate determinations of each tissue (mock, n = 7; 10 mg/kg, n = 7; 50 mg/kg, n = 6). The lines indicate medians, + indicates means, the boxes span the interquartile range, and the whiskers indicate the extremes.
