Figure 1.
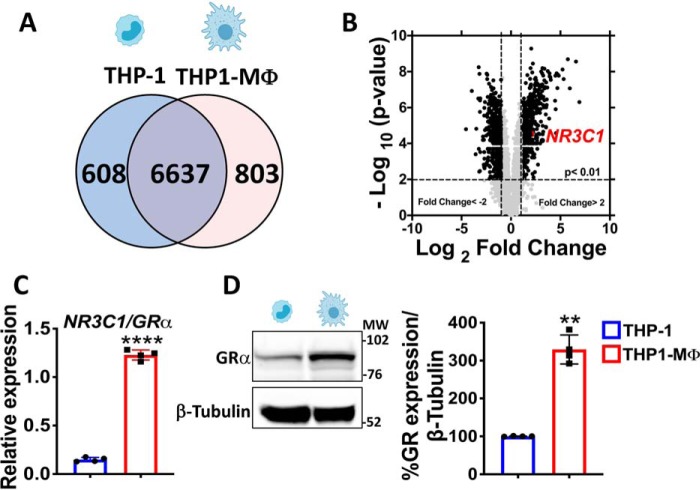
The transcriptome of macrophage-like THP-1 cells shows a higher GR expression compared with monocyte-like THP-1 cells. A, Venn diagram summarizing microarray data analysis shows the number of genes commonly expressed by THP-1 cells and MΦ-THP-1 and uniquely expressed in both cell types. B, volcano plot showing significantly differentially expressed genes in MΦ-THP-1 versus THP-1. In MΦ-THP-1 GR gene expression (also known as NR3C1/GRα) is 4-fold higher than THP-1. Shown is validation by qRT-PCR (C) and Western blotting (D) of GR expression that is higher in MΦ-THP-1 in comparison to THP-1. Data are mean ± S.D. (error bars) and are representative of four independent experiments. *, p < 0.05; two tailed unpaired Student's t test.

