Figure 3.
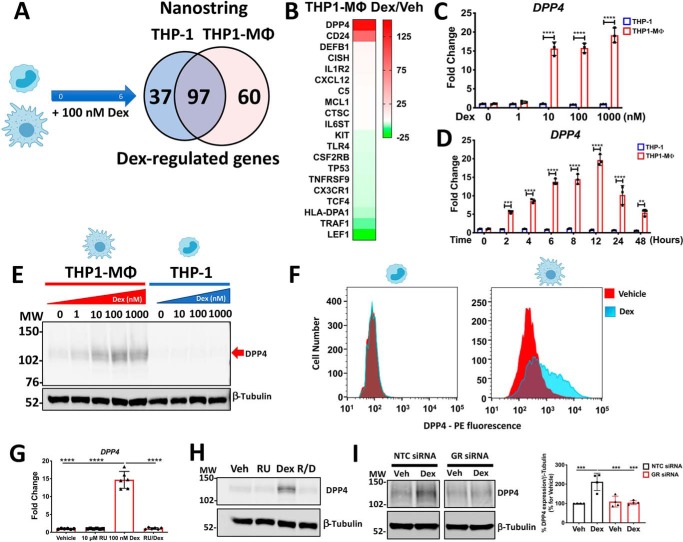
Glucocorticoids up-regulate DPP4 mRNA and protein levels in macrophage-like THP-1 cells by GR activation. A, a Venn diagram, summarizing NanoString Immunology code set data analysis, shows the number of genes commonly regulated by Dex in THP-1 cells and MΦ-THP-1 and uniquely regulated by Dex in both cell types. B, heat map of the top 10 up- and down-regulated genes by Dex in THP1-MΦ. C–F, glucocorticoid-induced DPP4 levels are uniquely expressed in THP1-MΦ. Shown are quantitative RT-PCR analyses of DPP4 mRNA levels in THP-1 and THP1-MΦ in Dex dose-response (C) and Dex time course (D) experiments. Shown are representative Western blotting (E) and flow cytometry (F) analysis of DPP4 protein from THP-1 and THP1-MΦ treated with 100 nm Dex for 24 h. The immunoreactive band is indicated by a red arrow. G–I, evaluation of GR participation in DPP4 up-regulation. Pharmacological inhibition of GR with RU-486 and GR knockdown by siRNA abolish Dex-induced expression of DPP4 at both mRNA (G) and protein (H and I) levels. Data are mean ± S.D. (error bars) and are representative of n = 3 to 6 independent experiments. **, p < 0.01; ***, p < 0.001; ****, p < 0.0001; two-way ANOVA test with Tukey's multiple-comparison test (C and D) and one-way ANOVA test with Tukey's multiple-comparison test (G and I).

