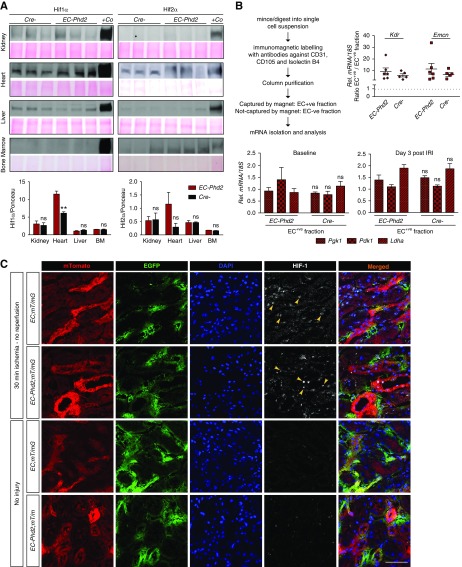
Figure 2.
Endothelial Phd2 inactivation is not sufficient to activate endothelial HIF signaling in the kidney. (A) Immunoblot analysis of HIF-1α and HIF-2α in kidney, heart, liver, and BM nuclear extracts isolated from EC-Phd2 mice or their Cre- littermate controls. Ponceau S staining was used to assess for equal protein loading. Nuclear kidney and lung extract from a mouse treated with an oral PHD inhibitor served as positive control (+Co) for HIF-1α and HIF-2α, respectively. Bottom graphs show densitometric analyses of HIF-1α and HIF-2α normalized to Ponceau. **P<0.01. (B) Shown is a summary of the experimental procedure followed to isolate ECs from the kidney. Right graph demonstrates the enrichment for the EC-specific genes Kdr and Emcn in ECs isolated from kidneys of EC-Phd2 mice or their Cre- controls. Enrichment is shown as ratio of transcript levels in the EC+ fraction versus the EC− fraction from each sample. The EC− fraction is the flow through from the immunomagnetic column. Bottom graphs show mRNA levels of Pgk1, Pdk1, and Ldha in EC+ fractions purified from the indicated genotypes under baseline or postischemic conditions (baseline: n=5–6; Pgk1 P=0.61, Pdk1 P=0.31, Ldhα P=0.32; day 3 post IRI: n=3–4; Pgk1 P=0.65, Pdk1 P=0.80, Ldhα P=0.93; two-tailed t test). Error bars represent SEM. (C) Representative images of immunofluorescence detection of HIF-1 on kidney cryosections from EC-Phd2;mT/mG and EC;mT/mG mice that underwent 30 minutes of unilateral renal artery clamping without reperfusion compared with uninjured kidneys. Shown are individual images for mTomato (red), EGFP (green), 4′,6-diamidino-2-phenylindole (DAPI) (blue), HIF-1 (white), and merged. Nonrecombined cells express membrane-bound mTomato, whereas recombined cells express membrane-bound EGFP. In the EC-Phd2;mT/mG mice, EGFP+ cells represent Phd2-deficient ECs; whereas in the EC;mT/mG controls, EGFP+ cells correspond to ECs competent for Phd2. Following 30 minutes of ischemia, there is significant nuclear stabilization of HIF-1, mainly in epithelial cells in both mutants and controls compared with baseline (no injury), whereas ECs show no difference in HIF-1 between genotypes. Yellow arrows indicate HIF-1–stained nuclei. Scale bar, 50 μm.

