Figure 2.
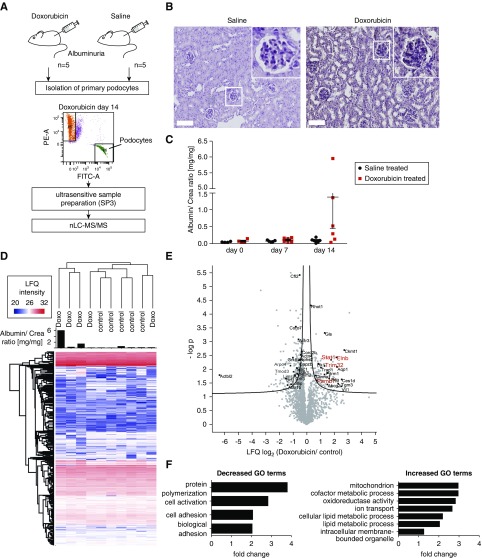
Proteomics analysis of isolated podocytes damaged by Doxorubicin revealed an upregulation of metabolic process, while adhesion processes were downregulated. (A) Workflow of Doxorubicin administration and sample preparation. NPHS2.Cre x mT/mG mice were treated with Doxorubicin (6 mg/kg body wt) or saline solution. FACS sorting of GFP-positive podocytes was performed. FACS-sorted podocytes were subjected to proteomic analysis by mass spectrometry. PE-A: tomato; FITC-A; GFP; red dots, Tomato-positive cells; green dots, GFP-positive cells; purple dots, cells out of gating. (B) Periodic acid-Schiff staining reveals morphologic changes upon Doxorubicin treatment in mice. Scale bar, 100 µm. (C) Albumin-to-creatinine ratios of animal urine after 7 and 14 days of Doxorubicin treatment. (D) Proteomic analysis of isolated podocyte fractions. Heatmap depicting LFQ protein expression between control and Doxorubicin-treated animals. Proteinuria per animal is depicted as a bar graph. (E) Volcano plot shows differentially regulated proteins when comparing proteinuric Doxorubicin versus control animals. Prioritized candidates such as Flnb (Filamin-B), STAT-1, PSMB7, and TRIM32 are depicted in red. (F) GO term enrichment analysis revealed an upregulation of metabolic processes, whereas actin-cytoskeleton–associated proteins were downregulated.

