Figure 2.
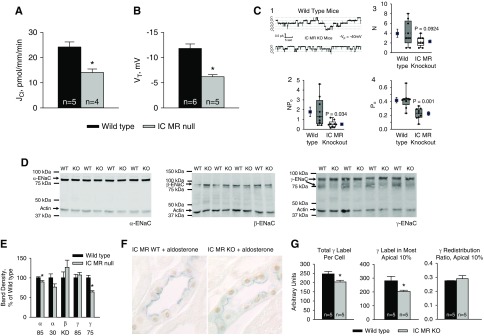
IC MR gene ablation reduces Cl− absorption, VT, Na+ channel activity, as well as ENaC subunit abundance and distribution in aldosterone-treated mice. (A) Cl− absorption and (B) VT were measured in CCDs perfused in vitro that were taken from aldosterone-treated IC MR null and wild-type littermates (treatment 4). (C1) Single-channel records from principal cell patches of split-open collecting ducts from aldosterone-treated wild-type and IC MR null mice. In (C1), “c” marks the current level when all channels are closed; “o” marks levels at which one or more channels are open. These records show less activity in the MR KO than in wild-type patches [(C2) P=0.034]. (C3 and C4) Values for the number of channels at the cell surface (N) and the open probability (Po). N is not significantly different in wild-type versus MR KO patches, whereas Po is significantly different (P=0.001). ENaC activity was measured as the number of channels times the open probability (NPo) in nine patches from MR KO and nine patches from wild-type mice. Data are shown as box plots, where the boxes are at the 25th and 75 percentiles and whiskers are at the 10th and 90th. Solid lines in the boxes are the median values, whereas dotted lines represent the mean. Individual data points are superimposed on the box plots. To the left and right of the boxes are mean value±SEM (solid squares). (D and E) ENaC subunit immunoblots of whole kidney lysates from aldosterone-treated IC MR null and wild-type mice and their relative band density. The α-ENaC blot displayed used the antibody that recognizes amino acids 46–68 of the rat sequence detects the 85, but not the 30 kD α-ENaC fragment. To detect both the 85 and the 30 kD α-ENaC fragment we used an antibody that recognizes amino acids 2–21 of the mouse sequence (Supplemental Figure 3). The number of mice used to generate the data displayed in (E) are as follows: 30 kD α-ENaC, 6; 85 kD α-ENaC, 10; β-ENaC, 4; 85 and 75 kD γ-ENaC, 4. (F) MR (brown) and γ-ENaC (blue) double-labeling in CCDs from mice from mice in both of these groups. (G) γ-ENaC total label per cell, label in the most apical 10% of the cell and γ-ENaC redistribution ratio in CCDs taken from aldosterone-treated IC MR null and wild-type littermates. *P<0.05.

