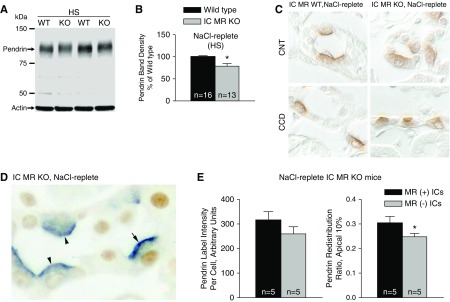
Figure 6.
MR gene ablation reduces pendrin protein abundance and pendrin's relative abundance in the most apical 10% of the cell in mice given a NaCl-replete diet. (A and B) Shown is a representative pendrin immunoblot (A) of kidney lysates from IC MR null and wild-type mice following the NaCl-replete diet (treatment 2) with pendrin band density (B). (C) Pendrin single-labeling in a representative cortical section from a NaCl-replete IC MR null and a wild-type littermate. (D) Pendrin (blue) and MR (brown) labeling of ICs in a representative cortical section from a NaCl-replete IC MR null mouse. (E) Pendrin label per cell (left) and pendrin label in the most apical 10% relative to label across the entire cell (right) were quantified in both the MR(+) (arrows) and MR(−) (arrowheads) ICs taken from the same NaCl-replete IC MR null mouse. *P<0.05.

