
Fig. 1: Arrests and convictions for violent crime.
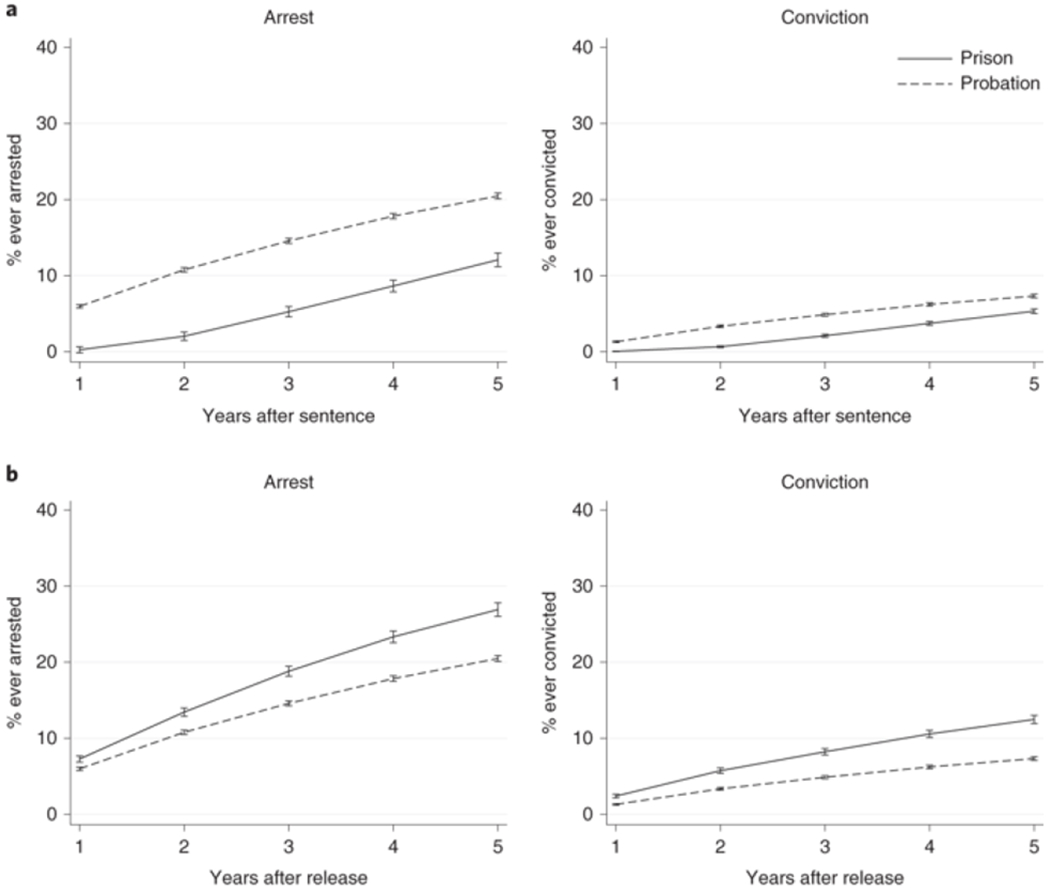
a,b, Cumulative percentages of individuals with one or more arrest (left) or conviction (right) for a violent crime during follow-up, by time since the sentence (a) and time since release (b), who received a baseline sentence of either prison or probation (unadjusted). Error bars represent 95% CIs. See Methods for definitions of risk periods, violent crimes, arrests and convictions. Sample sizes: arrest in a (all time points): prison, 19,979; probation, 43,606; conviction in a (all time points): prison, 19,977; probation, 43,605; arrest in b: 1 year: prison, 15,804; probation, 43,605; 2 years: prison, 14,978; probation, 43,605; 3 years: prison, 13,498; probation, 43,605; 4 years: prison, 11,811; probation, 43,605; 5 years: prison, 9,522; probation, 43,605; conviction in b: 1 year: prison, 17,273; probation, 43,606; 2 years: prison, 16,822; probation, 43,606; 3 years: prison, 16,294; probation, 43,606; 4 years: prison, 15,639; probation, 43,606; 5 years: prison, 14,668; probation, 43,606. Sample sizes at each time period in b vary due to differential follow-up time for time-since-release risk periods (see Methods). All point-in-time differences between prison and probation groups are statically significant at P < 0.001 (two-tailed t-tests of difference of means).