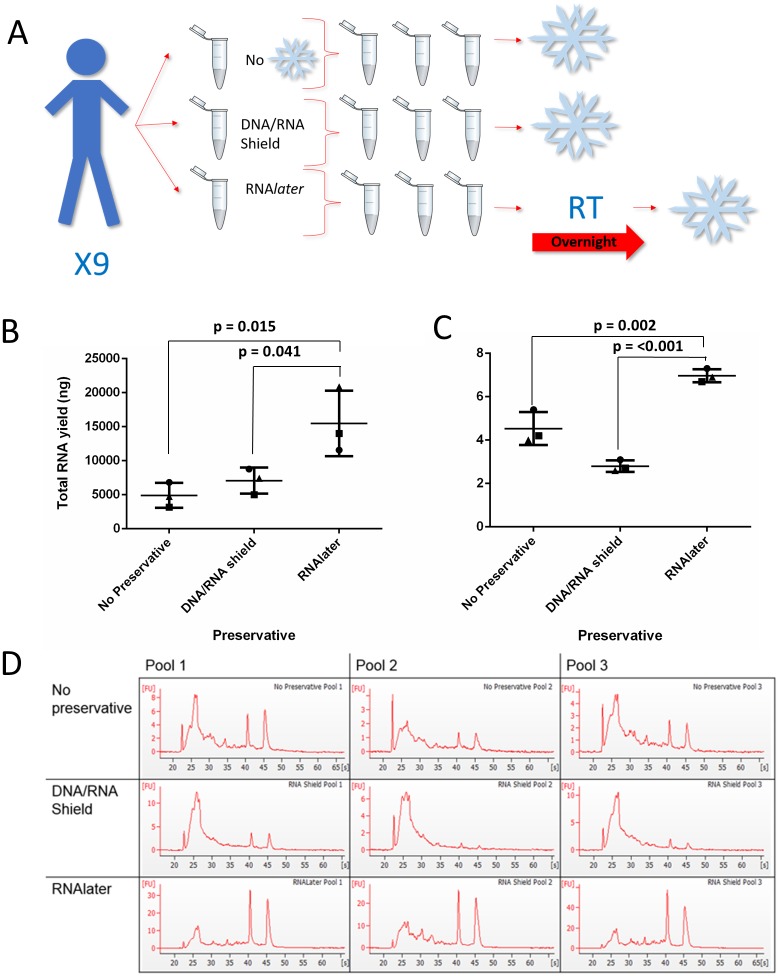
Fig 1. The effect of saliva collection with preservatives on RNA yield and quality.
To assess the effect of preservatives, saliva samples were collected from nine volunteers with two different preservatives and without and were pooled into three. (A) An overview of the experimental protocol showing how collection with the different preservatives was performed. Snowflake symbols indicate freezing at -80°C and RT = room temperature storage. (B) The yield was assessed using spectrophotometry (ng). (C) RNA integrity was assessed through a RIN value for each pool. A one-way ANOVA and a Tukey test were performed. The three different pools of samples are represented as circles, squares or triangles. Bars represent the mean concentration of the three pools while error bars represent SD. (D) Bioanalyzer traces for each pool of samples and each preservative are shown. Artwork was either drawn by the authors or downloaded from https://openclipart.org under the creative commons license.

