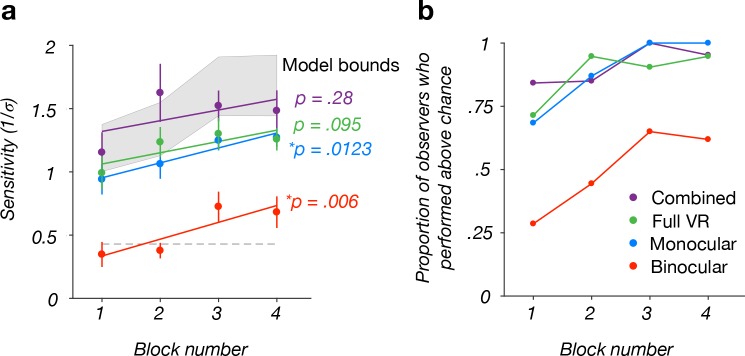
Fig 3. Relationship between sensitivity and experimental block number.
(a) Sensitivity to MID based on monocular cues (blue) and binocular cues (red) significantly improved with experimental block. Numerically similar trends were observed in the combined cues (purple) and full VR (green) conditions, but the improvements were not significant. Data points correspond to between-subject mean sensitivities. Error bars correspond to ±1 standard error of the mean (SEM). Lines are regression fits. The shaded area marks the range of sensitivities between the two-cue (lower-bound) and three-cue (upper-bound) model predictions (see Results for details). (b) Proportion of observers who performed above chance in each condition as a function of block.

