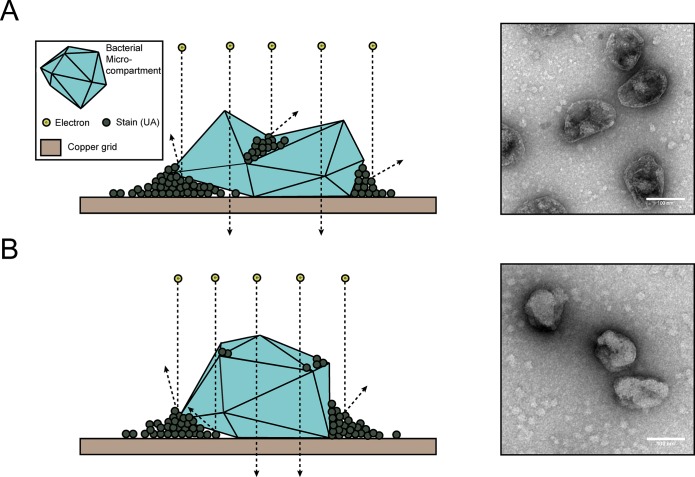
Fig 1. TEM of purified MCPs.
(A) Schematic representation and transmission electron micrograph of negatively stained purified MCPs. Note that MCPs appear collapsed as evidenced by the pooled stain near the center of MCPs. (B) Schematic representation and transmission electron micrograph of negatively stained purified MCPs that were first dehydrated in ethanol and a high vapor-pressure solvent (HMDS). Note that MCPs appear less collapsed than in (A). Scale bar (white) is 100 nm.

