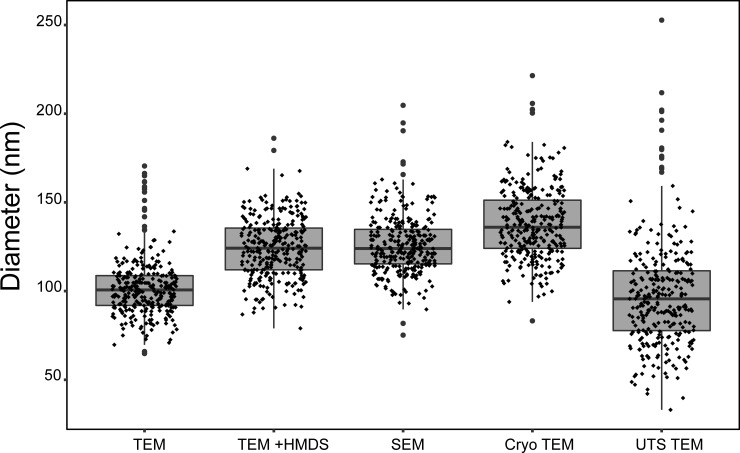
Fig 2. Apparent size of MCPs analyzed with different imaging techniques.
Box-and-whisker plot of the size distribution of MCPs analyzed with various techniques. Note that apparent size and distribution varies widely with each technique. A single-factor ANOVA test revealed that populations differed significantly (p < 0.001). The only populations that are not significantly different (as defined by a p-value greater than .001 in a two-tailed t-test) are TEM of purified MCPs vs thin section TEM and SEM of purified MCPs vs TEM of dehydrated samples (p = .12 and .26, respectively). N = 300 for all, where 100 measurements were made for each of three biological replicates (three different MCP growths and purifications). Abbreviations: transmission electron microscopy (TEM), transmission electron microscopy with samples dehydrated in hexamethyldisilazane (TEM + HMDS), scanning electron microscopy (SEM), cryo transmission electron microscopy (Cryo TEM), ultra-thin section transmission electron microscopy (UTS TEM).

