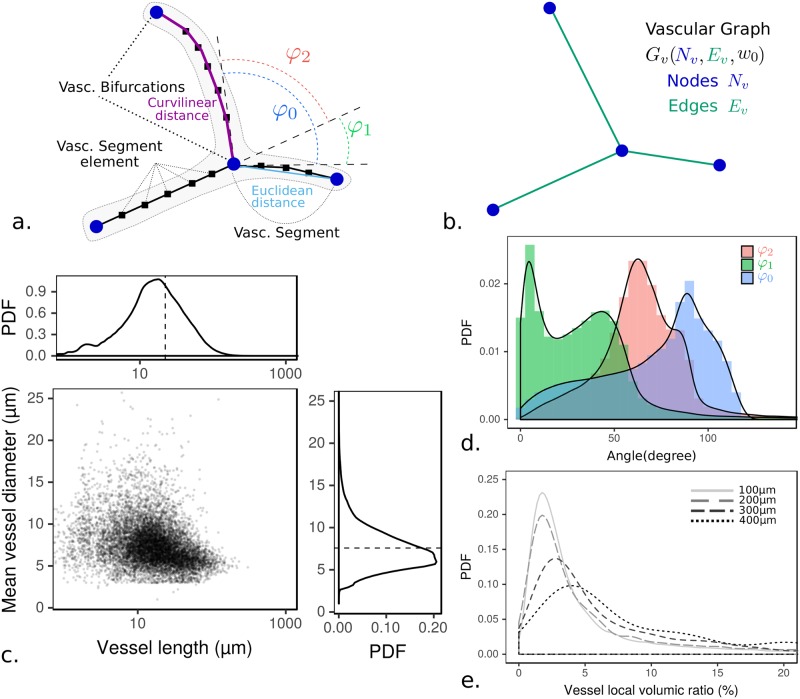
Fig 2. Vascular network statistics.
(a) Schematic representation of the vectorized vascular network and (b) the corresponding vascular graph with common key concepts in both cases. Note that vascular segments are turned into graph edges when the vascular network is mapped onto its graph representation. (c) Data for vessel length and diameter. The average aspect ratio is found equal to D/2L ∼ 1/8. (d) Histogram distribution of bifurcation angles (cf. Fig 1b for angle conventions). (e) Local vascular density (volumetric ratio) distribution measured in the whole network according to four elementary box size widths from 100μm to 400μm.

