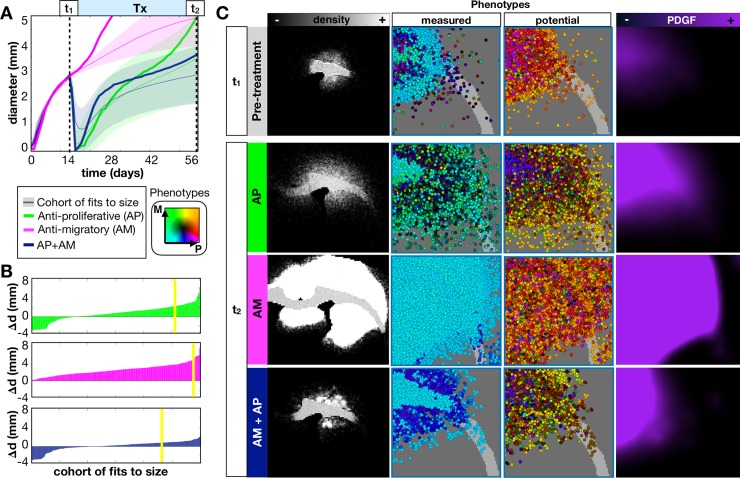
Fig 9. In-silico tumors treated with an anti-proliferative drug (AP), anti-migratory drug (AM), or an anti-proliferative, anti-migratory drug combination (AP+AM).
The drug is applied continuously at 14d until 28d. A) We show the growth dynamics for the AP, AM, and AP+AM treatments for the top 300 fits to the size dynamics. The average response (from 10 runs) to each treatment of the same diffuse tumor from the previous sections is also shown. B) Waterfall plot of the changes in tumor diameter from t1 to t2 for the cohort of top 300 fits to size when treated with AP (top) AM (middle), and AP+AM (bottom) treatments. The response of the diffuse tumor to these treatments is shown as a yellow line. C) Treating just the diffuse tumor example, we show representative spatial density distributions, the measured and potential phenotype distributions (colored according to the key), and the PDGF distribution. Movies are available at jillagal.github.io/multiscaleGBM.

