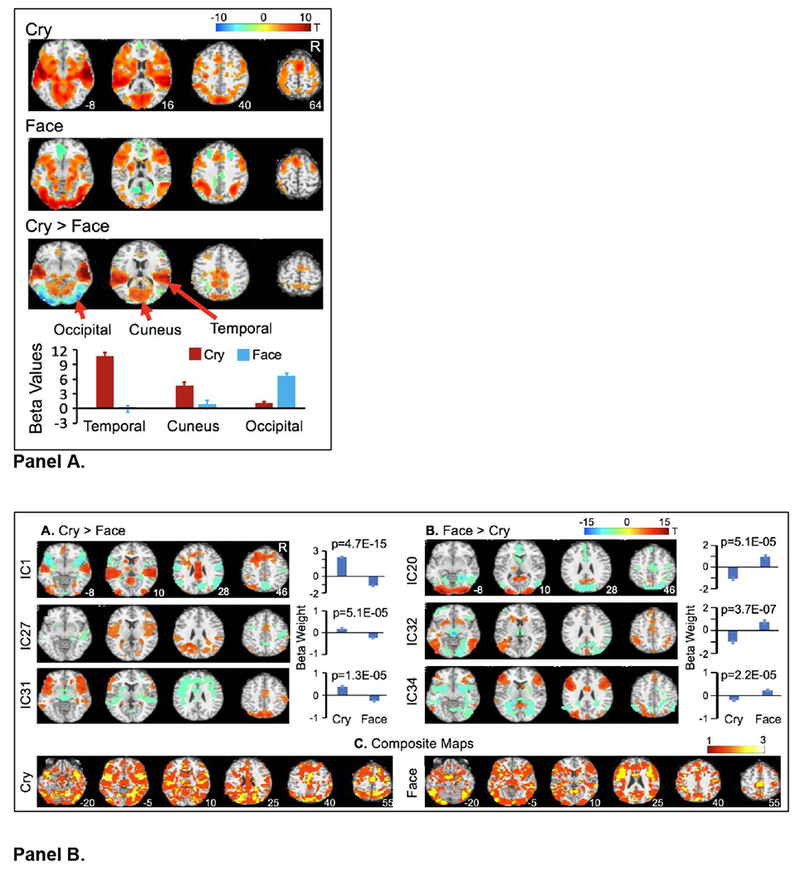
Fig. 1.

A Cry- and face-related changes in BOLD signal as revealed by GLM-based analyses. The colors on the T1 templates in MNI space show significant increases (red/orange) or decreases (blue/green) in BOLD signal for cry and face stimuli relative to baseline, and for cry relative to face stimuli (cry > face). The color bar indicates the t values. Only voxels surviving p<.01 and cluster p<.05, FWE-corrected for multiple comparisons of voxel-wise whole-brain analysis, are shown. The bar graph demonstrates mean beta values in three regions of interests (ROIs) for cry and face stimuli. The error bars represent standard errors (SE) of the means. The numbers presented next to each brain image in the top row indicate the Z coordinates in MNI space; R=right hemisphere. Fig. 1B. Bimodal FNs oppositely engaged by cry and face trials. (A & B) The colors on the T1 templates in MNI space show spatial distributions of positive (red/orange) and negative (blue/green) clusters in each labeled IC. The color bar at the top of the figure indicates the t values. Only voxels surviving p<0.001, FDR-corrected for multiple comparisons of voxel-wise whole-brain analysis are shown. The bar graph demonstrates mean beta weights at cry and face trials. The p value on each bar graph is corrected for multiple comparisons using FDR and indicates significant difference of mean beta-weights for the two stimuli types. The error bars represent SEs. The number at the right bottom of each brain image in the top row indicates the Z coordinate in MNI space; R=right hemisphere. (C) Composite maps of all significant clusters in the six ICs. The cry panel presents all clusters showing significant positive cry-related engagement and negative face-related engagement. The face panel presents all clusters showing significant positive face-related engagement and negative cry-related engagement. The color bar indicates the number of overlapping ICs.
