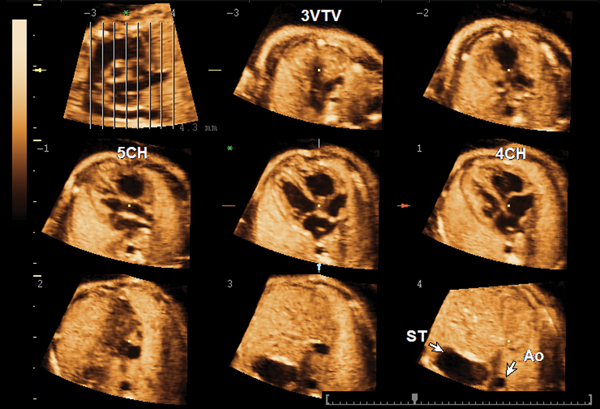
Figure 2.

Tomographic ultrasound imaging of a volume dataset of a normal fetal heart at 26 weeks. The image at the top left is denoted an “overview image” and shows the position of each slice within the volume dataset. A series of 8 tomographic images are automatically displayed from the top (−3) to the bottom plane (4). In this case, the plane sliced at position −3 shows the three-vessel and trachea view (3VTV); slice −1 shows the five-chamber view (5CH); slice 1 shows the four-chamber view (4CH); and slice 4 is a transverse section through the upper abdomen showing the stomach (ST) and descending aorta (Ao).
