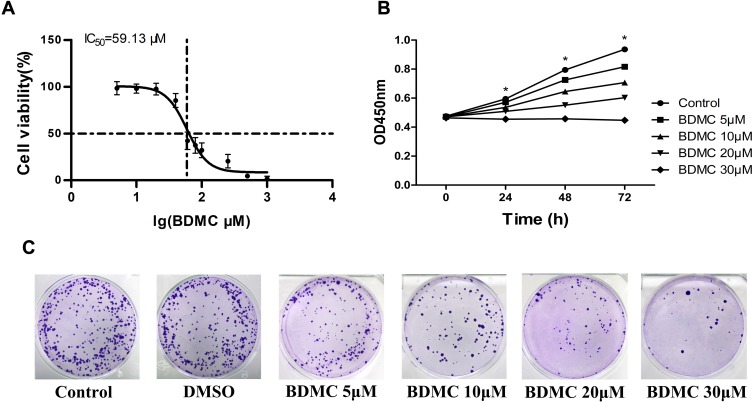
Figure 1.
Effects of BDMC on the viability of the hepatocellular cell line HepG2. (A) The half maximal inhibitory concentrations (IC50) of BDMC were measured by CCK-8 assay. (B) The effects of the indicated concentrations of BDMC on cell viability were measured by CCK-8 assays at 24, 48 and 72 h. (C) The proliferation of HepG2 cell lines at different concentrations of BDMC was detected by a colony formation assay. The data are representative of independent experiments (means ± SD) using one-way analysis of variance (ANOVA) to analyze the differences among groups. *Indicates P<0.05 between groups.

