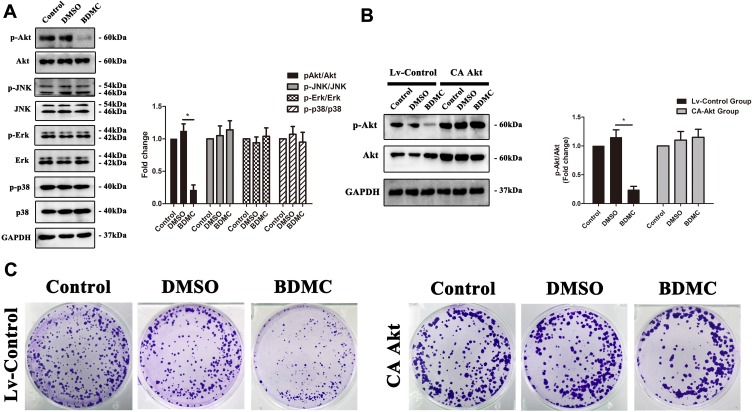
Figure 2.
BDMC inhibited the proliferation of HepG2 cells by suppressing Akt signaling pathway activation. (A) Activation levels of the Akt, JNK, Erk and p38 signaling pathway proteins in each group were detected by Western blotting. The results of Western blotting were quantified as the mean±SD intensity ratio of phosphorylated to nonphosphorylated proteins. (B) Phosphorylation levels of the AKT pathway proteins were assessed by Western blotting after transfection of constitutively active Akt1, which was quantified as the mean±SD intensity ratio of phosphorylated to nonphosphorylated proteins. (C) The proliferation of HepG2 cell lines in each groups was detected by a colony formation assay. The values are presented as the means±SD, using one-way analysis of variance (ANOVA) to analyze the differences among groups. *Indicates P<0.05 between groups.

