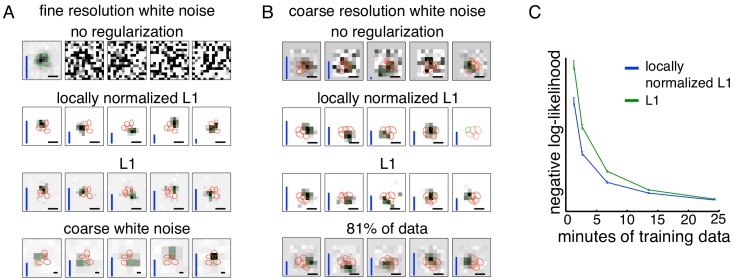
Figure 3. Spatially localized subunit estimation.
Comparison of different regularizers for estimating subunits using limited data. Examples of OFF parasol cells are shown. (A) Five subunits (most frequent optimum across cells from Figure 2) estimated using all data (1 hr 37 min) for fine resolution white noise without regularization (top row). The first estimated subunit is identical to the full receptive field and the others are dominated by noise. Locally normalized L1 (second row) and L1 (third row) regularization both give spatially localized subunits, with L1 regularization leaving more noisy pixels in background. In both cases, optimal regularization strength was chosen (from 0 to 1.8, steps of 0.1) based on performance on held-out validation data. The contours reveal interdigitation of subunits (red lines). Subunits estimated using white noise with 2.5x coarser resolution (24 min) and no regularization are larger, but at similar locations as subunits with fine resolution (bottom row). Height of vertical blue bars indicate the relative strength (average contribution to response) for each subunit (see Equation 6 in Materials and methods). Scale bar: 75 µm (B) For the cell in Figures 1A, 5 subunits estimated using the 3 min (10% of recorded data) of coarse resolution white noise responses are noisy and non-localized (top row). Similar to the fine case, using locally normalized L1 (second row) and L1 (third row) regularization both give spatially localized subunits, with L1 regularization subunits having noisier background pixels. The regularization strength (between 0 and 2.1, steps of 0.1) was chosen to maximize log-likelihood on held out data (last 5 min of data). Subunits estimated using 24 min (81% of data) of data are spatially localized and partition the receptive field (bottom row). Vertical bars same as (A). Scale bar: 150 µm (C) Held out log-likelihood for a 5 subunit model estimated from varying durations of training data with L1 (green) and locally normalized L1 (blue) regularization. Results averaged over 91 OFF parasol cells from Figure 1A.

